2016/20 Baccalaureate and Beyond Longitudinal Study (B&B:16/20) Tryouts and Focus Groups
NCES Cognitive, Pilot, and Field Test Studies System
Attachment VI - B&B 2016-20 Focus Group Materials to Test
2016/20 Baccalaureate and Beyond Longitudinal Study (B&B:16/20) Tryouts and Focus Groups
OMB: 1850-0803
National Center for Education Statistics (NCES)
Attachment VI
Sample Contacting Materials
2016/20 Baccalaureate and Beyond Longitudinal Study (B&B:16/20) Tryouts and Focus Groups
OMB# 1850-0803 v.242
November 2018
This attachment includes the rationale for testing different envelope and brochure designs and the designs to be discussed during focus groups, including 4 sample envelope designs and 4 sample brochures. Two handouts, one for each set of materials, to be completed by focus groups participants are also provided.
Contents
Background 5
Envelope Design Handout 6
Sample Envelope Design 1: Control 7
Sample Envelope Design 2: Note - "$2 Gift Enclosed" 8
Sample Envelope Design 3: Note - "Your next cup of coffee is on us" 9
Sample Envelope Design 4: Printed $2 Bill 10
Brochure Design Handout 11
Sample Brochure Design 1: Standard Flyer 12
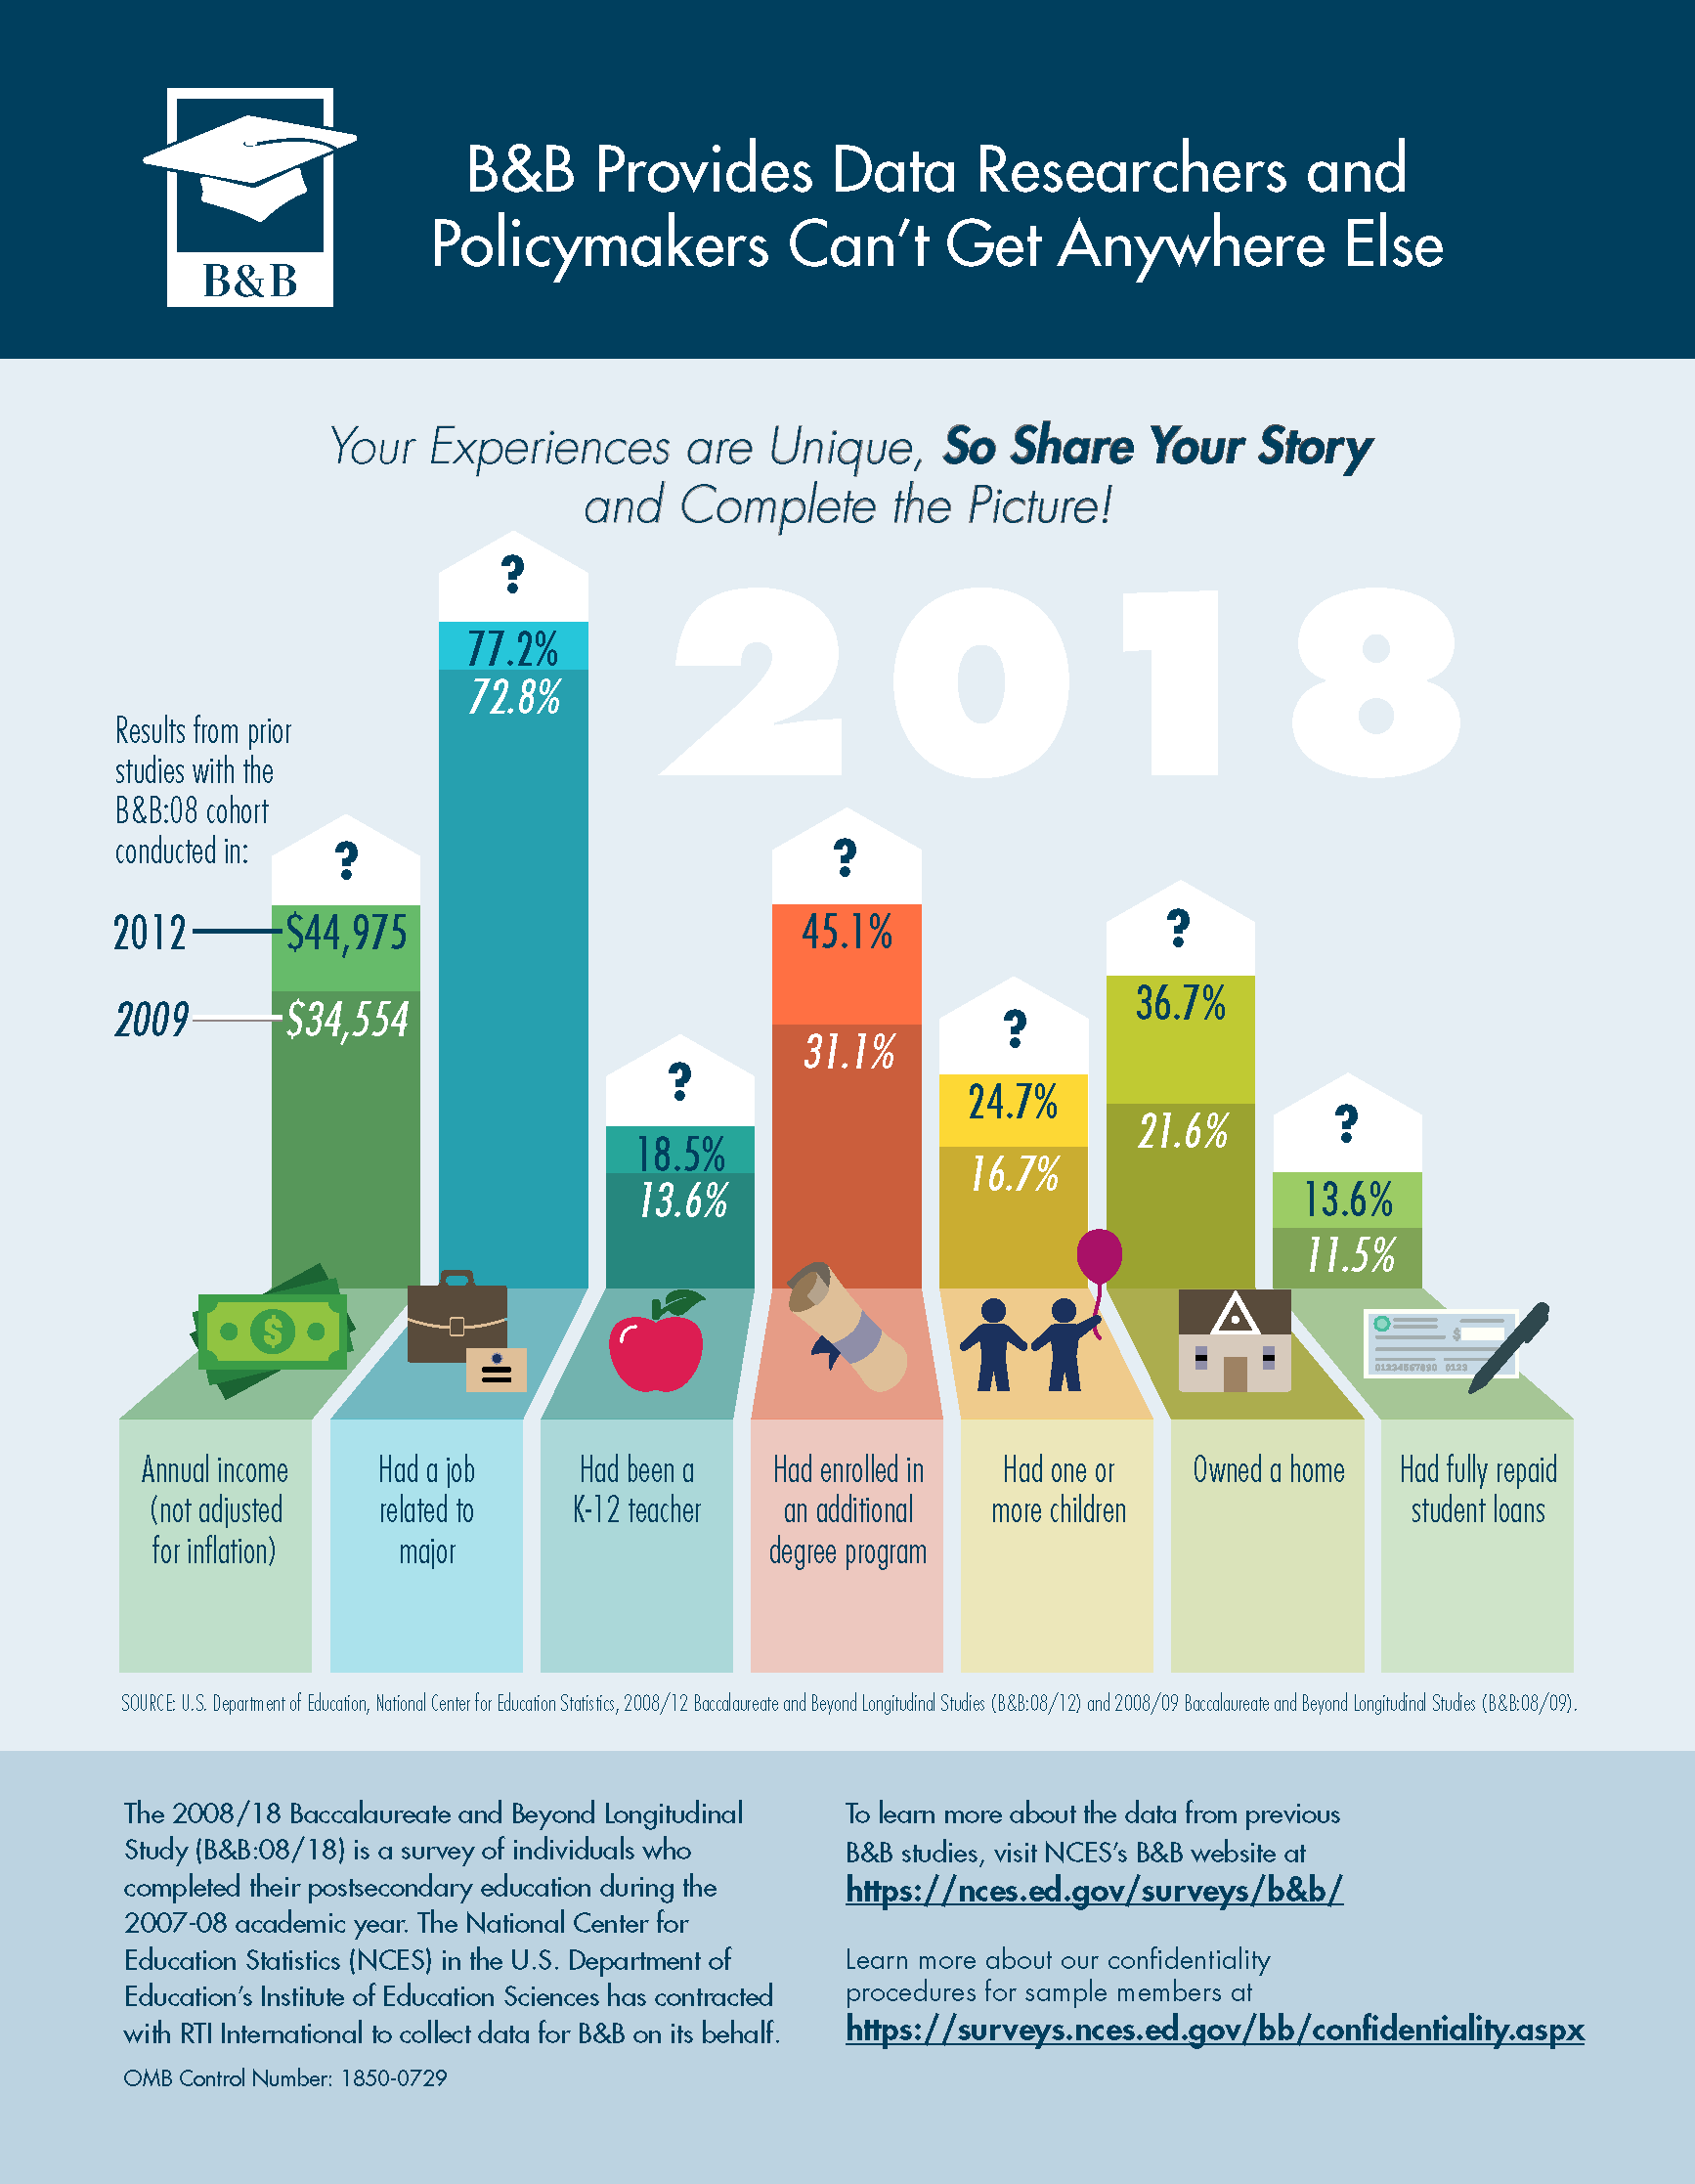
Sample Brochure Design 2: Infographic Flyer 14
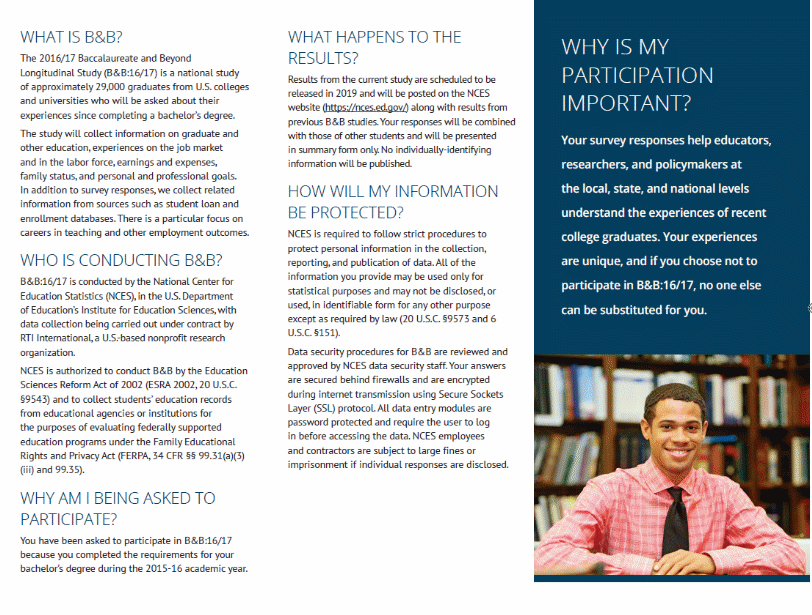
Sample Brochure Design 3: 3 Panel Brochure 15
Sample Brochure Design 4: 2 Panel Brochure 17
Background
While there is some research comparing different types of mailing, for example USPS First-Class to Priority Mail, and their effects on survey response rates and sample representativeness,1 there is little research regarding which features of the mailing are particularly effective to increasing response rates and representativeness. For example, are there particular visual design features of the envelope that survey designers can use to encourage sample members to open the envelope? If so, what are these features? An early study preparing the 2000 Census tested different messages on the outside of the envelopes.2 The results suggest that respondents do pay attention to such messages as a message appealing to the mandatory nature of the study increased response rates by approximately 10 percentage points compared to another message highlighting the benefits of participation. While other more recent studies do not find an increase in response rates when including envelope messages,3 DeBell and colleagues (2017) conducted an experiment in which they clipped a cash incentive to the mailing so that it was visible from the outside of the envelope. The study found that this envelope communicating to the sample member that a cash incentive was included in the mailing raised the response rate of their mail survey by almost four percentage points and led to slightly higher return to sender as undeliverable rates compared to a standard letter.
While we cannot state that participation in the B&B survey is mandatory, the latter result suggests that indicating that a cash incentive is included with the survey request and making the value of the incentive visible may significantly increase sample members’ interest in opening the mailing and, in turn, to consider the survey request. Based on this hypothesis, B&B:16/20 will conduct focus group discussions to better understand which mailing features motivate sample members to open or discard a mailing – and why. The goal is to design an envelope based on these findings and compare this ideal envelope in a potential B&B:16/20 calibration sample with the control envelope used in past B&B studies.
In the focus groups, we will test four different envelope designs, including:
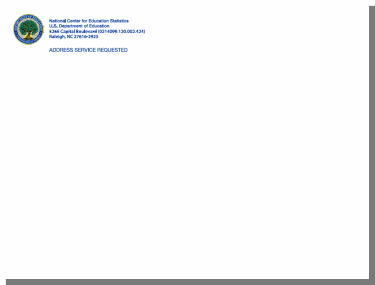
A standard envelope used in past studies (serving as a control)
Three envelope designs with a printed message that hints at cash being enclosed, including,
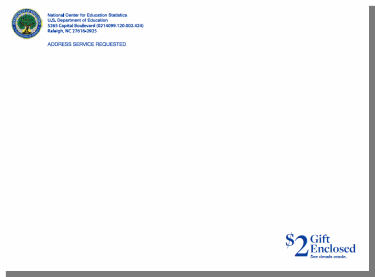
“$2 Gift Enclosed. See details inside”,
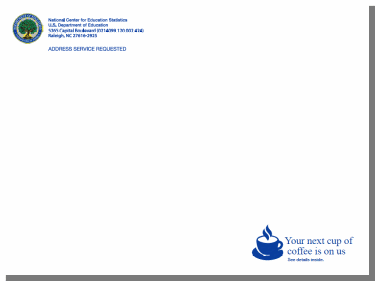
“Your next cup of coffee is on us. See details inside”, and
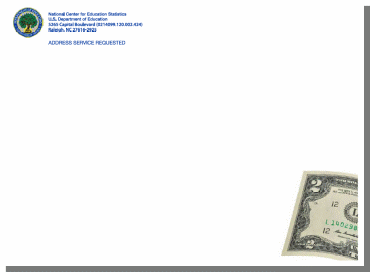
An envelope with a $2 bill printed in the corner.
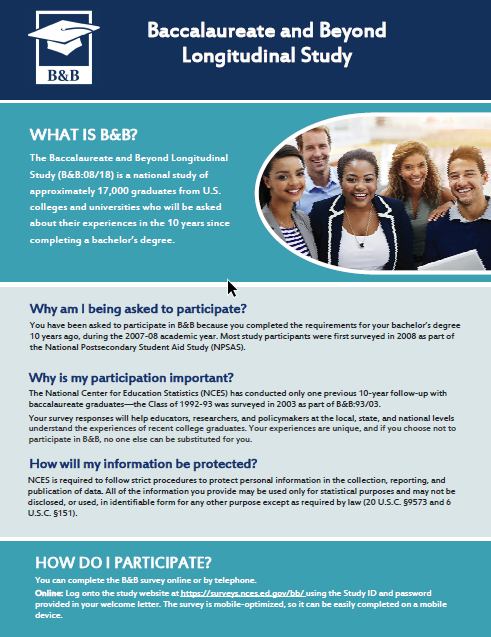
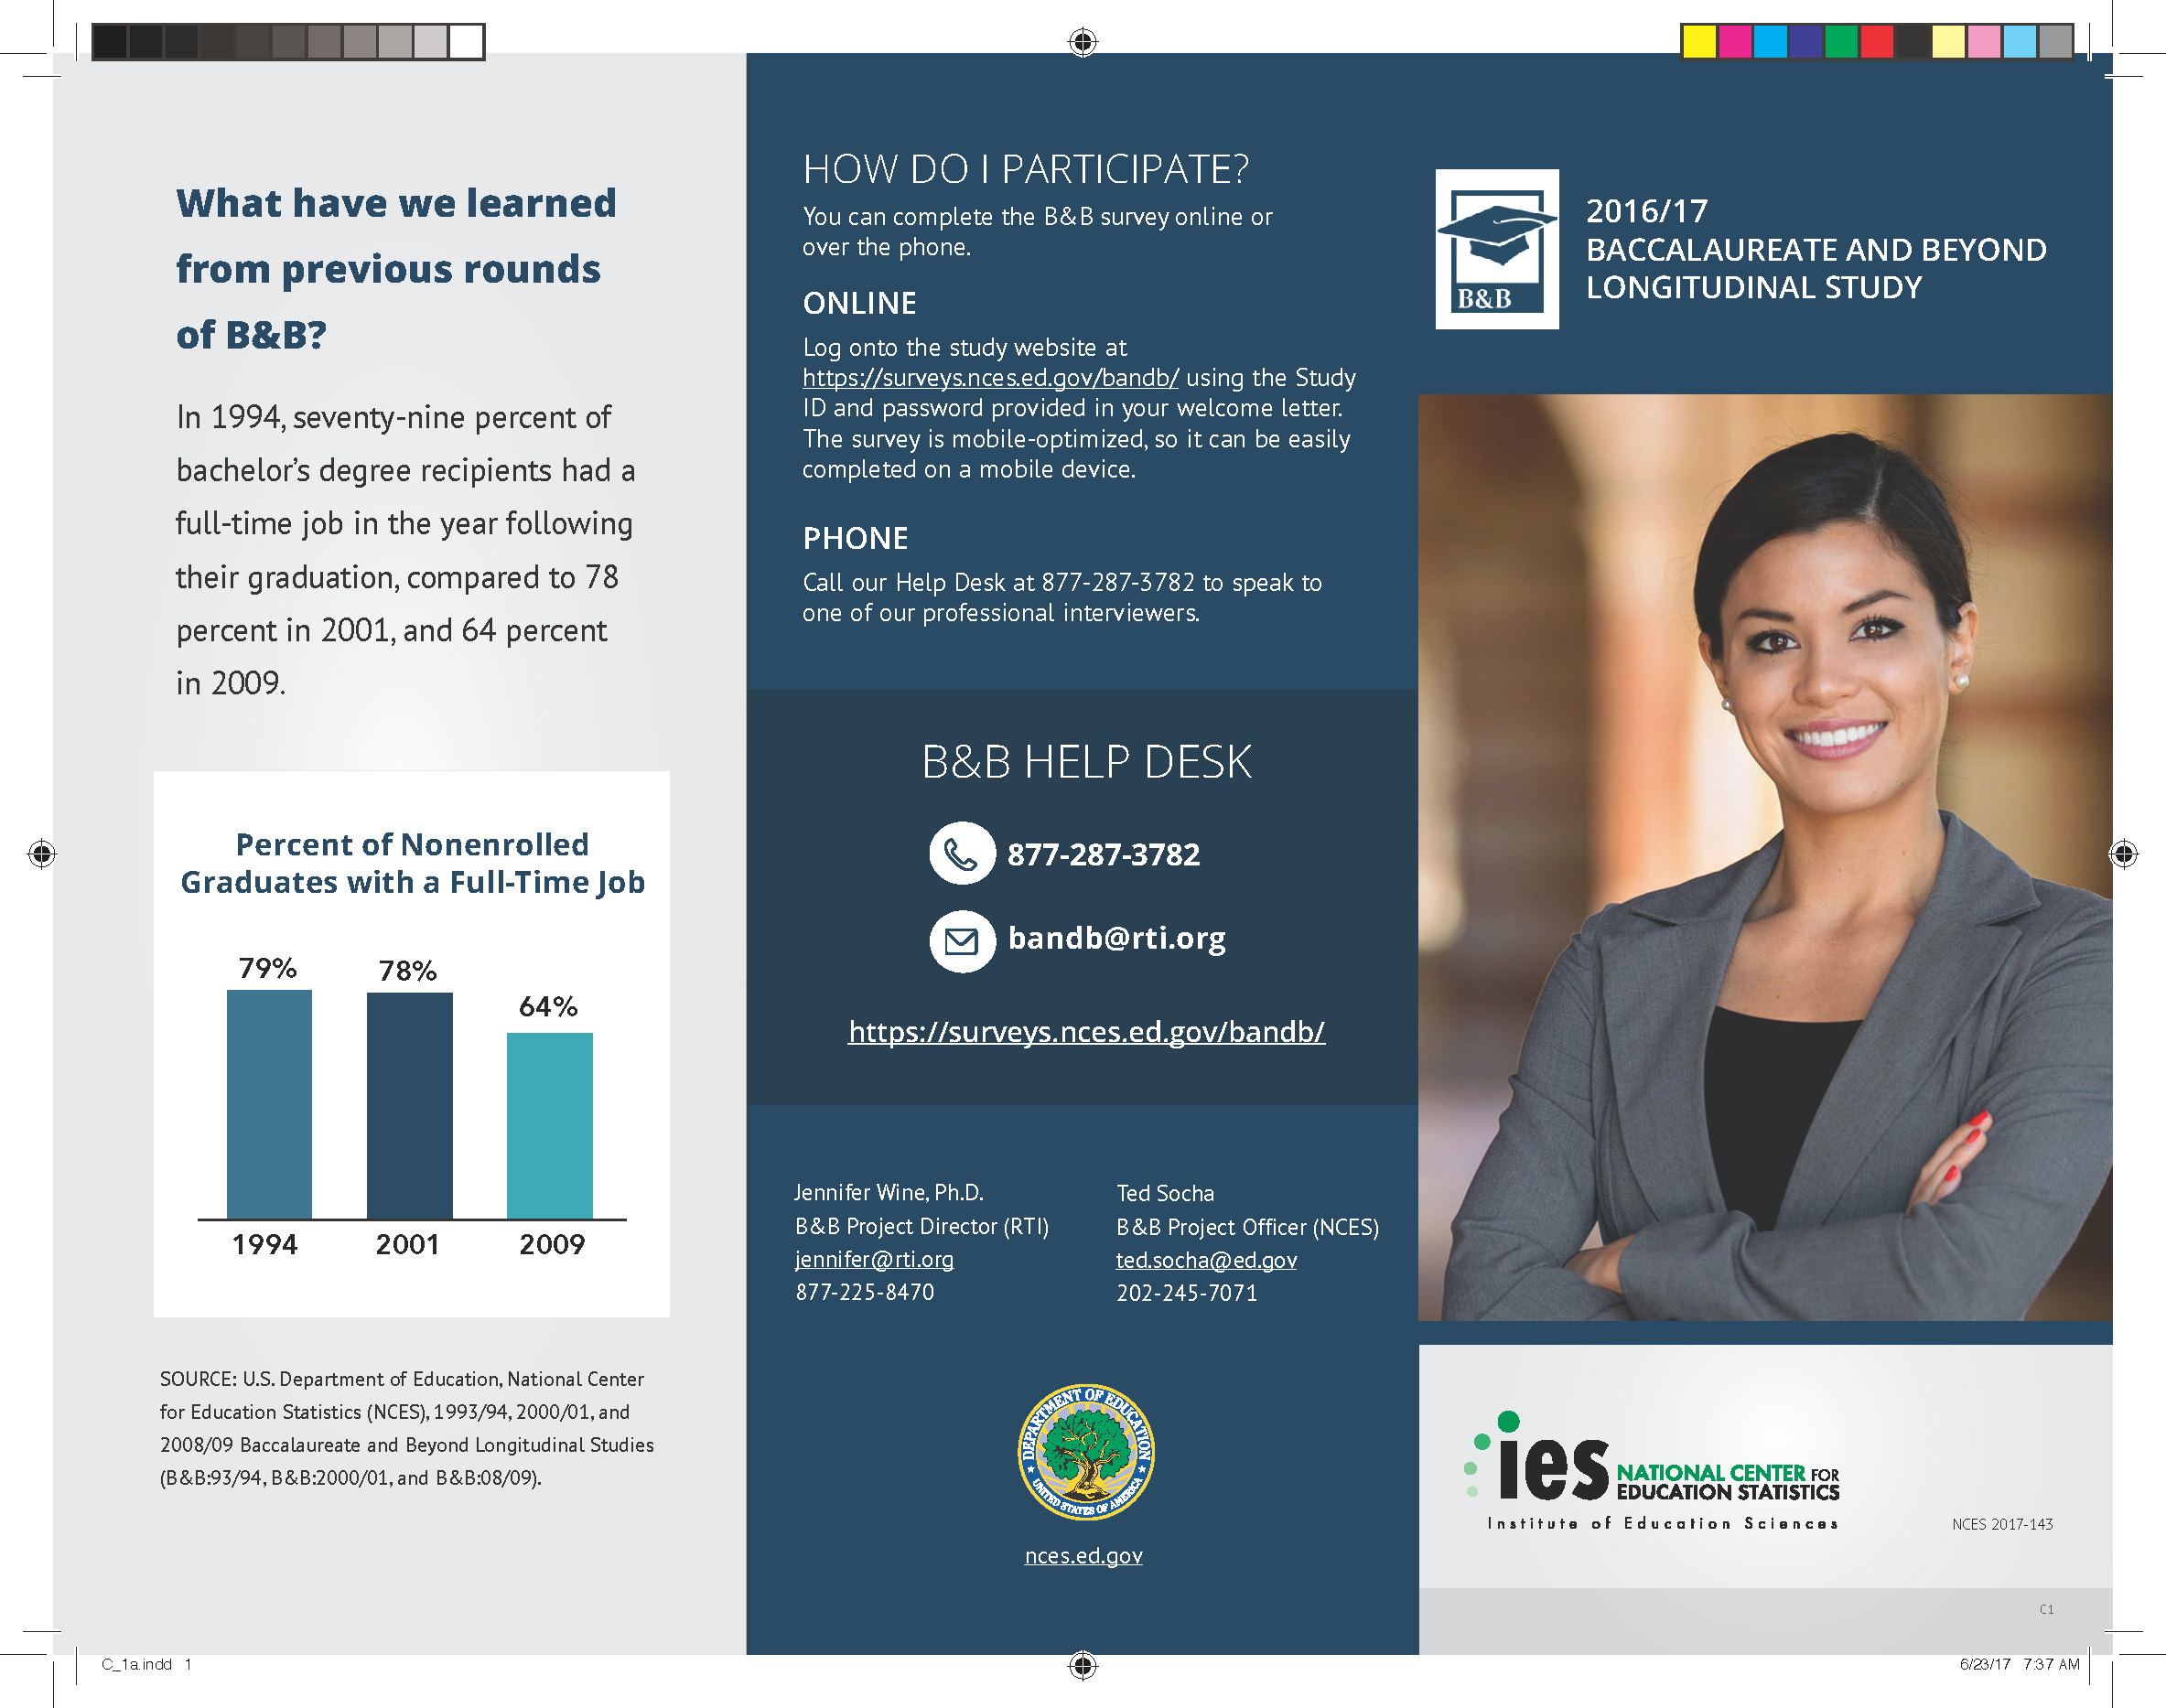
In addition to the study envelopes, it is important to periodically review the study materials included in the mailings. We will test different versions of alternative study brochures and flyers that may be more appealing to sample members compared to the standard brochures in use. We will investigate the content of the study brochures as well as alternative formats (e.g., brochure vs. flyer).
The following are the handouts for focus group participants to complete and the envelope and brochure designs that participants will discuss. For the focus group protocol in which the materials are referenced, see Attachment IV.
Envelope Design Handout
Please rank each of the following four envelopes with 1 =most likely to open and 4 = least likely to open. [Note: The order of the envelopes will be randomized, and the questionnaire will be designed professionally.]
|
|
|
|
|
|
|
|
Consider the envelope that you ranked the highest, that is, the one that you are most likely to open. On a scale from 1 to 10, where 1 is least likely and 10 is most likely, how likely are you to actually open this envelope?
-
1
Least Likely
2
3
4
5
6
7
8
9
10 Most Likely

Sample Envelope Design 1: Control
Sample Envelope Design 2: Note - "$2 Gift Enclosed"
Sample Envelope Design 3: Note - "Your next cup of coffee is on us"
Sample Envelope Design 4: Printed $2 Bill
Brochure Design Handout
Please select a maximum of three topics that you think should be included in a study brochure or pamphlet. [Note: The order of these topics will be randomized, and the questionnaire will be designed professionally.]
Study content
Study sponsor
Introducing the study team
Sample member selection
Data use
Privacy and Confidentiality
Sample member’s rights (voluntary participation, etc.)
Study contact/help desk information
Past results
Other, please specify: _________________
Please rank the three topics you just identified above in order of importance with 1 being the topic that you find most important to include and 3 being the topic that you find least important to include.
________________________
________________________
________________________
On a scale from 1 to 10, where 1 is least likely and 10 is most likely, how likely are you to actually read a brochure or pamphlet that you receive in the mail?
-
1
Least Likely
2
3
4
5
6
7
8
9
10 Most Likely

Sample Brochure
Design 1: Standard Flyer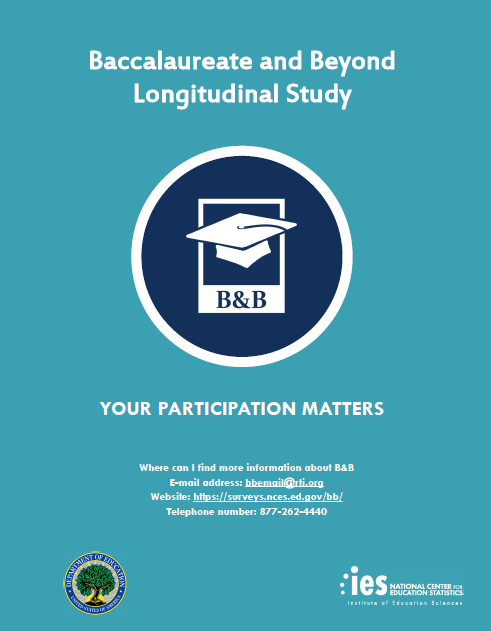
Sample Brochure Design 2: Infographic Flyer
Sample Brochure Design 3: 3 Panel Brochure

Sample Brochure Design 4: 2 Panel Brochure

1 DeBell, M., Maisel, N., Edwards, B., Amsbary, M., and V. Meldener. 2017. Improving General Population Survey Response Rates with Visible Money. Paper presented at the 72nd Annual Conference of the American Association for Public Opinion Research, New Orleans, LA.
2 Dillman, D.A., Jenkins, C., Martin, B., and T. DeMailo. 1996. Cognitive and Motivational Properties of Three Proposed Decennial Census Forms. Study Series (Survey Methodology #2006-4). Accessed 7/5/18: https://www.census.gov/srd/papers/pdf/ssm2006-04.pdf. Dillman, Don A., Jon R. Clark, and James Treat, 1994. The Influence of 13 Design Factors on Response Rates to Census Surveys. Annual Research Conference Proceedings, U.S. Bureau of the Census, Washington, D.C. Pp. 137-159. Accessed 7/5/18: https://babel.hathitrust.org/cgi/pt?id=mdp.39015052943357
3 Dykema, J., Jaques, K., Cyffka, K., Assad, N., Hammers, R.G., Elver, K., Malecki, K.C., & Stevenson, J. 2015. Effects of Sequential Prepaid Incentives and Envelope Messaging in Mail Surveys. Public Opinion Quarterly, 79(4), 906-931.
| File Type | application/vnd.openxmlformats-officedocument.wordprocessingml.document |
| File Modified | 0000-00-00 |
| File Created | 2021-01-20 |
© 2026 OMB.report | Privacy Policy


