Appendix F - Staff Focus Group Summary
Appendix F NPSAS 2024 Institution Staff Focus Group Summary.docx
2023-24 National Postsecondary Student Aid Study (NPSAS:24) Full-Scale Study - Institution Contacting and List Collection
Appendix F - Staff Focus Group Summary
OMB: 1850-0666
2023–24
NATIONAL POSTSECONDARY STUDENT AID STUDY (NPSAS:24) FIELD TEST
Student Data Collection and Student Records
Appendix F
Institution Staff Focus Group Summary
OMB # 1850-0666 v. 34
Submitted by
National Center for Education Statistics
U.S. Department of Education
August 2022
Contents
Topic 1: Enrollment List Collection F-10
Providing the Student Enrollment List for NPSAS:20 F-10
Enrollment List Collection for NPSAS:24 F-11
Topic 2: Student Records Handbook F-11
Expected to Complete Degree Requirements F-13
Instructional Mode (Distance vs. In-Person) F-14
Providing Budgeted Cost of Attendance F-15
Satisfactory Academic Progress F-16
Consortium Tuition Reductions F-17
Supplemental Educational Opportunity Grant (SEOG) F-17
Categorizing Financial Aid Program Types F-18
Recommendations for the Field Test Study F-19
Tables
Table 1. Participant's Institution Sector By Institution Department. F-4
Table 2: Participant's Occupational Title By Institution Department. F-5
Figures
Figure 1. Ease Of Determining Students To Include/Exclude On List F-9
Figure 2. Ease Of Formatting And/Or Coding Data F-9
Figure 3. Use Of Formatted Enrollment List File Template F-10
Figure 4. Participant's Use Of Student Records Handbook F-11
Figure 5. Amount Of Information In Student Records Handbook F-11
Figure 6. Ease Of Determining Likelihood Of Student Completing Degree Requirements F-13
Figure 7. Ease Of Providing Full-Time, Full-Year Budgeted Cost Of Attendance F-15
Figure 8. Ease Of Determining If "Full-Year Budget” Includes Summer Terms F-15
Figure 9. Ease Of Reporting Satisfactory Academic Progress Items F-16
Executive Summary
Introduction
This appendix summarizes the results of qualitative testing conducted in preparation for the 2023-24 National Postsecondary Student Aid Study (NPSAS:24) Field Test institution data collection. This testing included virtual focus groups with institution staff. Full details of the pretesting components were described and approved in NPSAS:24 generic clearance package (OMB# 1850-0803 v. 317). A summary of key findings is described first, followed by a detailed description of the study design, and finally a discussion of detailed findings from the focus group sessions.
Participants
Participants for focus groups were drawn from a list of institution staff who completed the most recent round of NPSAS data collection, NPSAS:20. Participants were recruited to obtain feedback from a variety of institution sizes, institution sectors, and roles or departments participants work in within the institution. Nineteen individuals participated in four focus groups, twelve of whom work in Institutional Research or related offices and seven work in Financial Aid or related offices.
Key Findings
Overall, participants reported a mix of experiences completing the NPSAS:20 data collection process. In many areas, such as determining who to include on enrollment list, completing the budget data, and determining financial aid type, participants found the process easy to understand and complete. A few key themes emerged across the four focus group discussions.
Providing data for NPSAS. Across all topics, participants discussed the importance of clear and detailed item definitions and file formatting specifications. Participants generally described being willing to provide the requested data, but do not want to make assumptions or guesses about how the data should be formatted. They requested that instructions provide a fine level of detail about requirements, such as whether leading zeroes should be included in a 2-digit month field. Some participants described data formatting as the most time-consuming part of the study and noted the time required to copy and paste data. Participants also mentioned the volume of error messages and requested more tools to identify the most important errors.
File Specifications. Similarly, participants requested very detailed and consistent file specifications, especially where there may be leading zeroes, such as with social security numbers and dates. For example, in the enrollment list discussion, participants identified issues with date conversions due to a lack of standardization between systems and the number of enrollment dates their institutions have, resulting in considerable date format changing. They also requested instructions for how to format the data depending on how it is downloaded (excel or CSV) as well as formatting instructions for each field. The need for explicit file specifications was also identified in the discussion about data checks.
Resources. Participants agreed that the student enrollment list instructions, the student records handbook, the data item codebook, and the financial aid cheat sheet were useful and should continue to be provided in future NPSAS collections. Participants recommended that the data item codebook be included within the handbook so that all instructions are contained in one place.
New enrollment list file template. Overall, participants reported that they would be interested in using the new enrollment list file template, although they thought that the error checks would be of limited benefit to them and thought that the error checks should be based on the needs of the study.
Instructional mode. Participants described the complexities of collecting data related to instructional mode and raised concerns about the lack of clear definitions and the effort required to manually review and code this data. Participants questioned how the data would be used and emphasized the importance of only asking for data that is necessary, and not including “wishlist” or “icing” data items.
Background
The National Postsecondary Student Aid Study (NPSAS), conducted by the National Center for Education Statistics (NCES), collects student data directly from postsecondary institutions. In order to improve the quality of the data collected as well as reduce the burden of completing the data request for institution staff, RTI International, on behalf of the National Center for Education Statistics (NCES), part of the U.S. Department of Education, contracted with EurekaFacts to conduct virtual focus group sessions with institution staff who are responsible for completing the NPSAS institution data request via the Postsecondary Data Portal (PDP).
In general, the focus groups addressed the following topics:
Instructions and resources provided to institution staff
Content of the data collection instrument
Ease of retrieving and providing required data
Study Design
Sample
A total of 19 institution staff participated in the focus groups. Participants were the responsible for providing data for the NPSAS:20 collection and currently work at an institution that participated in NPSAS:20. Participants were divided into two categories, Financial Aid (FA) or Institutional Research (IR), based on their department at the institution and/or the sections of the NPSAS:20 data collection they were responsible for completing.
Due to the desire to learn about each focus group categories’ specific experiences providing information for different sections of the NPSAS:20, all four focus groups were assigned a specific focus group category. See tables 1 and 2 for details about participant characteristics.
Table 1. Participant's institution sector by institution department.
Institution sector |
Financial Aid |
Institutional Research |
Total |
Private, for-profit, 4-year |
0 |
2 |
2 |
Private, not-for-profit, 4-year |
4 |
5 |
9 |
Private, 2-year |
1 |
0 |
1 |
Public, 4-year |
0 |
3 |
3 |
Public, 2-year |
2 |
2 |
4 |
Total |
7 |
12 |
19 |
Table 2: Participant's occupational title by institution department.
Role at the Institution |
Financial Aid |
Institutional
Research |
Total |
Assistant Vice President |
1 |
0 |
1 |
Coordinator |
0 |
1 |
1 |
Corporate Bursar |
1 |
0 |
1 |
Director |
4 |
6 |
10 |
Registrar |
0 |
2 |
2 |
Research Analyst |
0 |
1 |
1 |
Research Manager |
0 |
1 |
1 |
Vice President |
0 |
1 |
1 |
Unknown |
1 |
0 |
1 |
Total |
7 |
12 |
19 |
Recruitment and Screening
RTI conducted the outreach and recruitment of Institution Staff from an existing list. In addition to being on the list, participants had to be a current employee at the institution that participated in NPSAS:20, responsible for providing some of the data for NPSAS:20, and comfortable speaking in front of other postsecondary educational professionals. Institution staff were stratified into two categories based on their institutional position and/or the sections of the NPSAS:20 student records collection they were responsible for completing:
Financial Aid (FA)
Institutional Research (IR)
All recruitment materials, including but not limited to initial outreach communications, Frequently Asked Questions, reminder and confirmation emails, and informed consent forms, underwent OMB approval.
Each focus group ranged from three to seven participants for a total of 19 participants across four focus groups. All focus group participants who wished to receive an incentive were sent a $60 e-gift card virtually as a token of appreciation for their efforts; not all participants accepted an incentive.
To ensure maximum “show rates,” participants received a confirmation email that included the date, time, a copy of the consent form, and directions for participating in a virtual focus group. All participants received a follow-up email confirmation and a reminder telephone call at least 24 hours prior to their focus group session to confirm participation and respond to any questions.
Data Collection Procedure
EurekaFacts conducted four 90-minute virtual focus groups using Zoom, between June 16th and June 30th, 2022.
Session Logistics. Prior to each virtual focus group, a EurekaFacts employee created a Zoom meeting with a unique URL. All participants were sent a confirmation e-mail that included the unique link for the virtual Zoom meeting. In order to allow enough time for technological set-up and troubleshooting, participants were requested to enter the Zoom meeting room fifteen minutes prior to the start time of the session. When this time arrived, the moderator adjusted the security of the virtual room to allow participants to enter. Participants were greeted by the moderator and asked to keep their microphones muted and webcams off until it was time for the session to begin. At the scheduled start time of the session, participants were instructed to turn on their microphones and webcams before being formally introduced to the moderator.
At the end of the focus group session, participants were thanked and informed on when to expect the virtual $60 e-gift card. The recording of the session was then terminated, and the Zoom meeting ended to prevent further access to the virtual room.
Consent Procedures. Data collection followed standardized policies and procedures to ensure privacy, security, and confidentiality. Written consent was obtained via e-mail prior to the virtual focus group for most participants. However, participants that did not return a consent form prior to joining the Zoom meeting were sent a friendly reminder and a private message by a EurekaFacts staff member. The consent forms, which include the participants’ names, were stored separately from their focus group data and are secured for the duration of the study. The consent forms will be destroyed three months after the final report is released. At the beginning of each session, participants were reminded that their participation was voluntary and that their answers may be used only for research purposes and may not be disclosed, or used, in identifiable form for any other purpose except as required by law. Participants were also informed that the session would be recorded.
Focus Group Content. Discussion topics were distributed across focus groups such that each group was only administered probes relevant to the sections of data collection they completed for NPSAS:20. The two focus group category types were:
Financial Aid/Bursar/Student Accounts/Student Financial (FA) (2 sessions)
Institutional Research/Institutional Effectiveness/Institutional Planning/Registrar (IR) (2 sessions)
Focus group sessions progressed according to an OMB-approved moderator guide. The moderator guide was used to prompt discussion of staffs’ experiences completing the different data collection tasks, methods of communication, and proposed data feedback report. While the moderator relied heavily on the guide, focus group structure remained fluid and participants were encouraged to speak openly and freely. The moderator used a flexible approach in guiding focus group discussion because each group of participants was different and required different strategies to produce a productive conversation.
Topics for each session varied based on participants’ department at the institution. After introductions, the following topics were discussed in the focus groups:
Topic 1: Enrollment List Collection (IR groups)
Topic 2: Student Records Handbook (all groups)
Topic 3: Enrollment (IR groups)
Topic 4: Budget (FA groups)
Topic 5: Financial Aid (FA groups)
Coding and Analysis
The focus group sessions were audio and video recorded using Zoom’s record meeting function. After each session, a coder utilized standardized data-cleaning guidelines to review the recording and produce a datafile containing a high-quality transcription of each participant’s commentary and behaviors. Completely anonymized transcriptions tracked each participant’s contributions from the beginning of the session to its close. As the first step in data analysis, coders’ documentation of focus group sessions in the datafile included only records of verbal reports and behaviors, without any interpretation.
Following the completion of the datafile, two reviewers reviewed it. One reviewer cleaned the datafile by reviewing the audio/video recording to ensure all relevant contributions, verbal or otherwise, were captured. In cases where differences emerged, the reviewer and coder discussed the participants’ narratives and their interpretations thereof, after which any discrepancies were resolved. The second reviewer conducted a spot check of the datafile to ensure quality and final validation of the data captured.
Once all the data was cleaned and reviewed, research analysts began the formal process of data analysis. In doing so, these staff looked for major themes, trends, and patterns in the data and took note of key participant behaviors. Specifically, analysts were tasked with identifying patterns within and associations among participants’ ideas in addition to documenting how participants justified and explained their actions, beliefs, and impressions. Analysts considered both the individual responses and the group interaction, evaluating participants’ responses for consensus, dissensus, and resonance.
Each topic area was analyzed using the following steps:
Getting to know the data – Several analysts read through the datafile and listened to the audio/video recordings to become extremely familiar with the data. Analysts recorded impressions, considered the usefulness of the presented data, and evaluated any potential biases of the moderator.
Focusing on the analysis – The analysts reviewed the purpose of the focus group and research questions, documented key information needs, focused the analysis by question or topic, and focused the analysis by group.
Categorizing information – The analysts gave meaning to participants’ words and phrases by identifying themes, trends, or patterns.
Developing codes – The analysts developed codes based on the emerging themes to organize the data. Differences and similarities between emerging codes were discussed and addressed in efforts to clarify and confirm the research findings.
Identifying patterns and connections within and between categories – Multiple analysts coded and analyzed the data. They summarized each category, identified similarities and differences, and combined related categories into larger ideas/concepts. Additionally, analysts assessed each theme’s importance based on its severity and frequency of reoccurrence.
Interpreting the data – The analysts used the themes and connections to explain findings and answer the research questions. Credibility was established through analyst triangulation, as multiple analysts cooperated to identify themes and to address differences in interpretation.
Limitations
The key findings of this report were based solely on analysis of the Institution Staff virtual focus group discussions. The value of qualitative focus groups is demonstrated in their ability to provide unfiltered comments from a segment of the target population. Rather than functioning to obtain quantitatively precise measures, qualitative research is advantageous in developing actionable insight into human-subjects research topics. Thus, while focus groups cannot provide absolute answers, the sessions can play a large role in gauging participant attitudes toward new resources and features, as well as identify the areas where staff consistently encounter issues compiling and submitting the NPSAS data request.
As noted above, some moderation guide topics and probes were administered to only a subset of the participants. Even when probes were administered, every participant may not have responded to every probe due to the voluntary nature of participation, thus limiting the number of respondents providing feedback. Moreover, focus groups are prone to the possibility of social desirability bias, in which case some participants agree with others simply to “be accepted” or “appear favorable” to others. While impossible to prevent this, the EurekaFacts moderator instructed participants that consensus was not the goal and encouraged participants to offer different ideas and opinions throughout the sessions.
Findings
This section presents detailed findings from the focus groups with institution staff.
Topic 1: Enrollment List Collection
Institution staff were asked to discuss their experience with completing the NPSAS:20 list of eligible students enrolled at their institution during the 2019-2020 academic year, focusing on success of determining which students to include or exclude from the list and formatting or coding to meet file specifications. Participants were asked for feedback on a new template option for submitting the student enrollment list and automated list data checks. Topic 1 was presented to two focus groups consisting of 12 Institutional Research (IR) staff.
Providing the Student Enrollment List for NPSAS:20
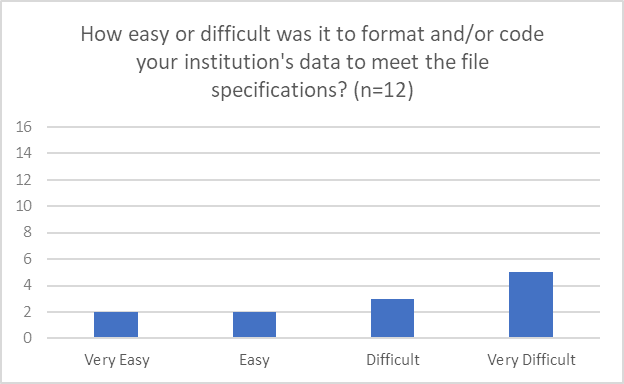
Overall, a majority of IR participants (11 out of 12) indicated that they had no trouble determining which students to include on the enrollment list (see figure 1). Participants recalled experiencing difficulty formatting or coding their institution’s data to match the file specifications (figure 2).
Figure 1. Ease of determining students to include/exclude on list
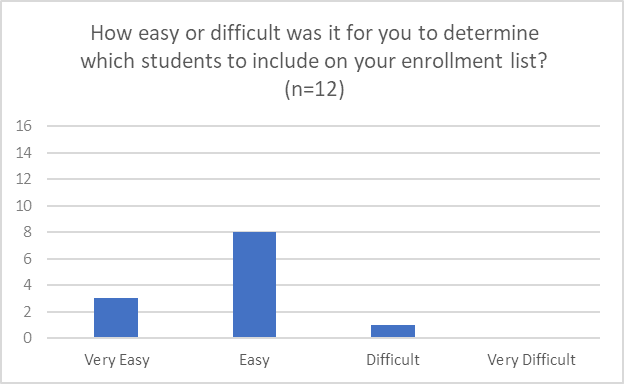
Figure 2. Ease of formatting and/or coding data
Two participants noted confusion about the enrollment period for students to be included on the student enrollment list (July 1 through April 30) versus the enrollment period collected in student records data (July 1 through June 30).
Enrollment List Collection for NPSAS:24
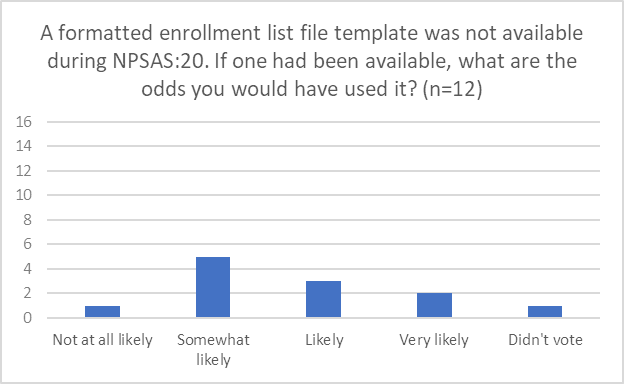
Participants were asked to review a sample student enrollment list template file and provide feedback on the usefulness of the template. Overall, participants expressed interest in using a formatted enrollment list file template, with one participant noting “I generally use a template whenever that’s an option” (figure 3).
Figure 3. Use of formatted enrollment list file template
Data Checks
Participants were presented with plans for error checking their enrollment list files immediately upon upload and asked to consider what data checks would be useful to them. Participants did not have suggestions and generally deferred to the project team to define what error checks are needed, with one participant commenting, “what's useful for us is what's useful for you so to make sure that it fits your format.”
Participants questioned whether it would be feasible to check student enrollment list counts against data from IPEDS, given that the reporting periods and eligibility requirements for IPEDS and NPSAS are different.
Summary
A majority of participants found the enrollment list collection process to be straightforward, however participants did provide suggestions to improve the process. First, participants noted the importance of very detailed file specifications, including instructions for field lengths, capitalization rules, and formatting dates. Similarly, providing clearer guidelines regarding dates would help mitigate any possible confusion surrounding which annual format is being requested (fiscal, calendar, academic, etc.) and helps ensure that all institutions are reporting accurately.

“Yeah,
I couldn't have done it without the Handbook, I'm not going to make
this stuff up by myself.”
Topic 2: Student Records Handbook
This section focuses on the participants’ experiences using the Student Records Handbook and explored how helpful they found the handbook. Topic 2 was presented to four focus groups consisting of 12 Institutional Research (IR) staff and 7 Financial Aid (FA) staff.
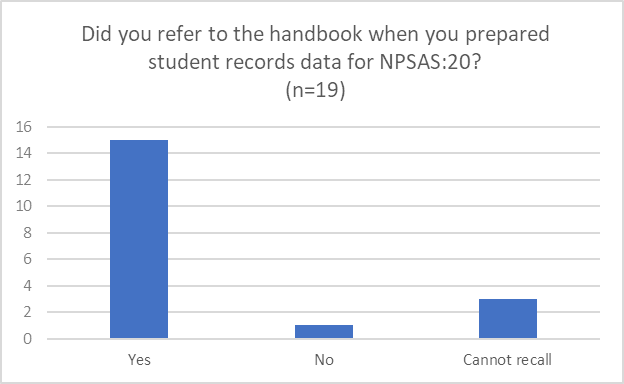
Institution staff were asked to discuss their experience referencing their handbook when preparing student data records for NPSAS:20. Overall, 15 out of 19 participants (IR and FA) indicated they referenced the handbook when preparing student records data for NPSAS:20 (figure 4). Those who used the handbook reported it was very useful. One participant noted, “Yeah, I couldn't have done it without the handbook, I'm not going to make this stuff up by myself.”
Figure 4. Participant's use of student records handbook
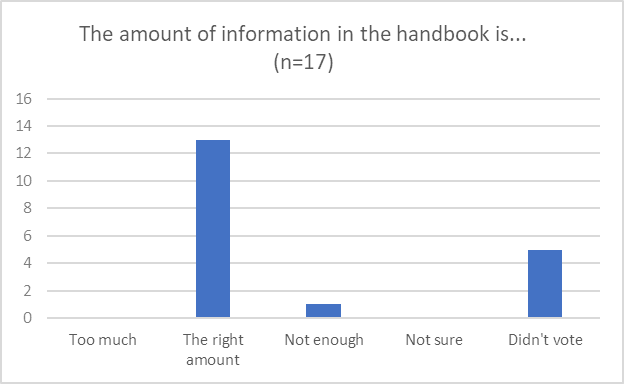
A majority of participants who responded (13 out of 17) indicated that the amount of information in the handbook was appropriate (figure 5).
Figure 5. Amount of information in student records handbook
Summary
Participants generally found the handbook helpful with the right information. They requested that detailed definitions for all items should be included and suggested that the data item codebook be added to the handbook.
Topic 3: Enrollment
This section requested participants’ feedback on several items from the Enrollment section of the student records instrument, including reporting remedial course-taking, expected degree completion, tuition, and distance vs. in-person instruction. Topic 3 was presented to two focus groups consisting of 12 Institutional Research (IR) staff.
Remedial Course-taking
About half (5 out of 10) reported that their institutions offered remedial classes. Four participants added that their institutions refer to these courses as “developmental” and not “remedial.” Some participants noted that their institutions are moving away from offering remedial courses, and that developmental content is being combined with other coursework.
One participant stated that their institution uses the term “gateway courses” to refer to introductory courses, which they described as “like an intro level into the major.” Participants generally agreed that the most difficult part of responding to this item is due to the portion that requests remedial courses taken at other institutions.
Expected to Complete Degree Requirements
“I
would say it's probably difficult, just because the programs vary in
length. So,
we'd be looking at cumulative credits, versus the total number of
credits, in addition to enrolled credits. And so, it's really just a
guess, and it would just take a little bit of time with all the
different majors to identify how close the students are.”
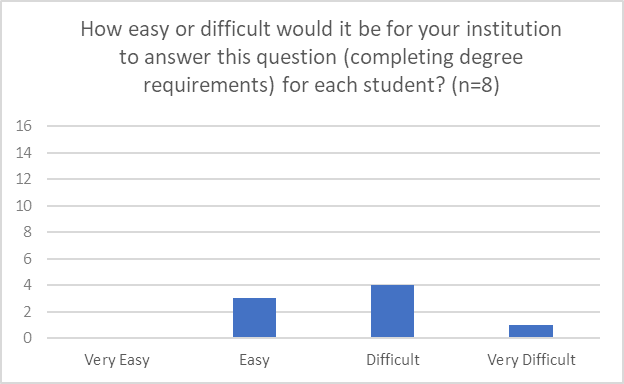
One participant mentioned that the timing of the request might require them to “predict the future.” Another participant stated, “I would say it's probably difficult, just because the programs vary in length. So, we'd be looking at cumulative credits, versus the total number of credits, in addition to enrolled credits. And so, it's really just a guess, and it would just take a little bit of time with all the different majors to identify how close the students are.”
Figure 6. Ease of determining likelihood of student completing degree requirements
Instructional Mode (Distance vs. In-Person)
“Once
you get to hybrid courses, this is a monster data issue.”
Participants universally agreed that instructional mode is a complex and continually evolving data issue. Both IR groups reported that their institutions are adapting to demand and offering students flexibility, and that they are already grappling with terminology, definitions, and how to handle these complexities for other reporting obligations, such as state reporting, accreditation, and IPEDS. One participant commented, “If you figure this out, you'll make a million dollars because no one knows what these words mean,” while another stated, “Once you get to hybrid courses, this is a monster data issue.”
Participants emphasized the importance of clear definitions and mentioned a broad array of scenarios that would be challenging for them to categorize without explicit instructions for how to code courses. Five participants mentioned that it would be difficult to report data using percentages due to students attending hybrid sessions in which the setting changes frequently based on the instructor, or that some courses are offered both virtually and in-person at the same time. As one participant explained,
“The other thing is I agree with the general comment that three options is not really enough because in the original question, you group synchronous and asynchronous, and we have distance degree programs, which are asynchronous programs and students kind of learn, they access materials. But we have multiple campuses and extension offices, and we'll have faculty in person on one campus with students in person at that campus simultaneously delivering over video communication, whether that's Zoom or whether that's a more traditional video conferencing setup and so, how would you code a class? We know how we code it on our end, but it's like, where would you want something like that? Where the faculty member is synchronously interacting with all the students at the same time, some of whom are in the classroom and some of whom are not.”
Of the seven participants who responded, a majority (6 out of 7) recommended that using distinct response categories would be the best way for them to report the data. In addition, several participants expressed not understanding what the data is being used for because they do not see how this data relates to financial aid and reported that obtaining this level of detail would be “extremely complicated.”
Tuition Credits
In terms of institutions offering tuition credits to students for use in future terms, of the seven participants asked, all stated that they are not aware of this occurring at their institution. As a result, none of the other related probes were discussed.
Summary
Participants reported few challenges reporting enrollment data for NPSAS:20. The most significant difficulties related to reporting remedial coursework taken at prior institutions and reporting whether students were expected to complete their degree requirements by June 30. Participants raised numerous concerns about reporting students’ instructional mode, describing it as a challenging data problem without standard definitions or terminology. Participants were concerned about the effort required to review students’ course schedules and code each course.
Topic 4: Budget
This section focused on participant experiences providing budget information, specifically in terms of full-time, full-year costs of attendance, ease of determining if the full-year includes the summer, and error messages. Topic 4 was presented to two focus groups consisting of five Financial Aid (FA) staff and two Institutional Research (IR) staff.
Providing Budgeted Cost of Attendance
Institution staff were asked to discuss their experience with providing budgetary information for the NPSAS:20. Most participants (5 out of 7) found providing full-time, full-year budgeted cost of attendance data to be ‘easy’ or ‘very easy’ (figure 7). Two participants noted that staff from their financial aid department had some difficulty providing budget data because of unusual structures and the enrollment patterns of students. One of these participants cited some confusion about reporting budget data when a student attends just one term in the year.
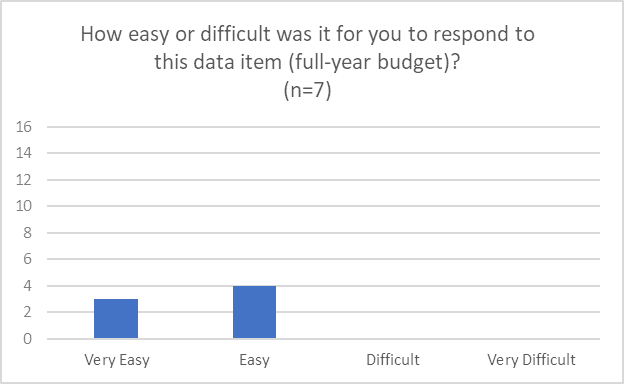
When asked for the ease or difficulty of indicating whether their “full year” budget includes summer terms, all seven participants reported it would be ‘easy’ or ‘very easy’ to do (figure 8).
Figure 7. Ease of providing full-time, full-year budgeted cost of attendance
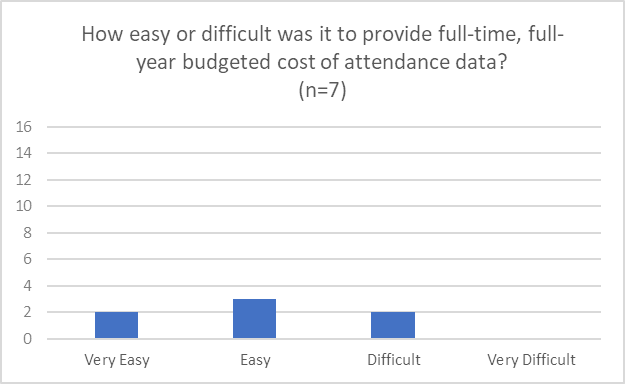
Figure 8. Ease of determining if "full-year budget” includes summer terms
Summary
Overall, participants found this section to be straightforward and easy to comprehend. The instructions could be expanded to provide additional guidance for students that only attended for one term in the reporting period.
Topic 5: Financial Aid
This section addresses participants’ experiences providing financial aid data, specifically related to reporting Satisfactory Academic Progress, Supplemental Educational Opportunity Grants, participation in consortium tuition reductions, determining financial aid program types, and distinguishing between need- and merit-based aid. Topic 5 was presented to two focus groups consisting of five Financial Aid (FA) staff and two Institutional Research (IR) staff.
Satisfactory Academic Progress
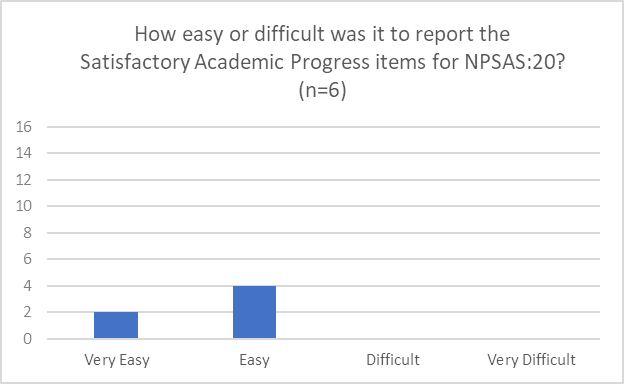
All the participants who responded (6 out of 6) claimed that reporting Satisfactory Academic Progress data was ‘easy’ or ‘very easy’ (figure 9). Participants indicated that removing the Satisfactory Academic Progress items would make the financial aid section easier, but only because it would be “one less thing” to report rather than due to the difficulty of providing the data.
Figure 9. Ease of reporting Satisfactory Academic Progress items
Consortium Tuition Reductions
When asked about how they would report tuition and financial aid data for students receiving consortium tuition reductions, only one participant described being familiar with this scenario and how the institution records data in their system. The participant noted that these students are easy to identify in their system and are coded with a specific student type value.
Supplemental Educational Opportunity Grant (SEOG)
About half of participants reported that their institution does not have emergency SEOG or could not recall having students receiving emergency SEOG. Other participants could recall how they reported it in NPSAS:20 student records, but noted that they most likely included it with other SEOG unless instructed otherwise.
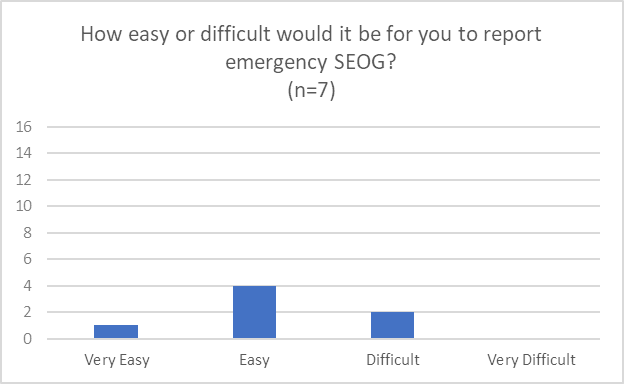
When asked if separately reporting emergency SEOG aid would be easy or difficult, most of the participants (5 out of 7) said it was easy or very easy, with the other two participants reporting it was difficult (figure 10). One of these participants stated that they “would have to go into Banner and create another fund code for emergency SEOG.” The other individual who stated it was difficult, appeared to be seeking an N/A option and chose difficult, without explanation.
When asked about the typical timing of emergency SEOG disbursement, three participants noted that emergency SEOG funds were usually disbursed at the beginning of each semester.
Figure 10. Ease of reporting emergency SEOG
Categorizing Financial Aid Program Types
Participants were asked to provide feedback on categorizing the program type for each financial aid award, including differentiating between need-based and merit-based aid. Just over half of the participants (4 out of 7) indicated that it was ‘easy’ or ‘very easy’ to determine the aid program type (figure 11).
Figure 11. Ease of determining program aid type
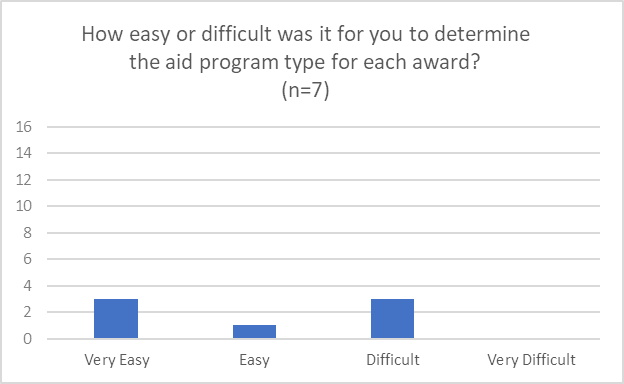
Two of the participants who claimed it was difficult stated that the difficulty stems from the number of aid options and “sorting through all the different types here and assigning them to each one was just a bit difficult just from a volume perspective.” Three participants recalled using the Financial Aid Cheat Sheet during NPSAS:20 and found it helpful; the remaining four participants did not recall ever using the Financial Aid Cheat Sheet, but some noted that they would be interested in using a Cheat Sheet in the future. Another participant suggested that the Cheat Sheet be expanded as an interactive tool that could be tailored to the state and specific institution.
Participants generally noted that it was easy to distinguish between need-based and merit-based aid, with multiple participants noting that these categorizations are recorded in their data systems. One participant reported that they were “not used to using” that terminology at their institution.
In the discussion about challenges to reporting financial aid data, one participant noted the limit of three financial aid awards in each category (state aid, institution aid, private and other government aid, and other aid). Another participant noted that HEERF dollars were a challenge when it comes to reporting financial aid data and that they already do extensive reporting of those aid disbursements.
Summary
The Financial Aid discussion centered around reporting Satisfactory Academic Progress, which participants indicated was easy or very easy to do, and emergency Supplemental Educational Opportunity Grant (SEOG) aid, which most participants also reported was easy. Participants also discussed need- vs. merit-based aid and use of the Financial Aid Cheat Sheet, which a few participants used and found helpful. Although participants did not offer much feedback about the challenges of reporting financial aid data, one participant expressed some confusion about the limit for three aid awards, suggesting that any limits to aid awards should be clearly outlined to mitigate possible confusion and contradiction.
Recommendations for the Field Test Study
Findings suggest that institution staff experienced little difficulty reporting most data items for NPSAS:20. Participants generally found the item wording and handbook helpful but requested that the handbook include all detailed data item definitions. For NPSAS:24, the data item codebook will be added to the handbook.
Some challenging data items and areas for improvement were identified. Participants noted difficulty reporting whether students took remedial courses at other institutions. For NPSAS:24, the item wording will be updated to clarify that institutions should respond based on data available in its own records. Participants also reported difficulty reporting whether students were expected to complete their degree requirements in the NPSAS year, describing multiple approaches they would use to make a determination, such as by conducting a degree audit, checking whether students had applied to graduate, and looking at cumulative credits earned versus credits required for their program. For NPSAS:24, the item will be updated to provide a “does not apply” response option for students not in bachelor’s degree programs and an “unknown” response option to be used when institutions cannot report this data. Some participants reported confusion about how to report financial aid for students with more than three awards in one aid category, which is the maximum number of awards accepted by the student records collection instrument. For NPSAS:24 field test, the handbook will be updated to provide additional instructions for reporting more than three awards in each category.
Participants raised numerous concerns about the prospect of collecting instructional mode in student records, citing the lack of standard definitions or terminology and the absence of consistent records in their data systems. Participants were concerned about the effort and complexity involved to manually review and code students’ course schedules. NPSAS:24 field test will not collect instructional mode and the student level and instead will collect high-level information about the breadth of instructional mode scenarios that occur at sampled institutions.
| File Type | application/vnd.openxmlformats-officedocument.wordprocessingml.document |
| Author | administrator |
| File Modified | 0000-00-00 |
| File Created | 2023-07-31 |
© 2026 OMB.report | Privacy Policy