Pilot Test and Cog Lab Results
Appendix C-D BPS 2012-17 Pilot Test & Cog Lab Results.docx
2012/17 Beginning Postsecondary Students Longitudinal Study: (BPS:12/17)
Pilot Test and Cog Lab Results
OMB: 1850-0631
2012/17 Beginning Postsecondary Students Longitudinal Study: (BPS:12/17)
August 2016
Appendixes C and D
Appendix C: Results of the BPS:12/17 Pilot Test Experiments 1
Appendix D: Qualitative Evaluation for Student Records – Summary of Findings and Recommendations 10
2012/17 Beginning Postsecondary Students Longitudinal Study: (BPS:12/17)
Appendixes
C
Results of the BPS:12/17 Pilot Test Experiments
Several experiments were included in the BPS:12/17 pilot test student interview to evaluate alternative methods to administer questions. Three experiments tested new designs for assisted coding forms, or “coders,” used to identify standardized codes for text string responses. A fourth experiment tested revised question wording, using “forgiving” introductory language that could mitigate social desirability bias on a question intended to collect data on academic performance through grade point average (GPA).
Sample members were randomized to either a treatment (N = 580) or control (N = 587) group. Members of the treatment group were eligible to receive all four experimental forms while the control group was administered the non-predictive search forms.
Evaluation of predictive search coders
Predictive search tools, sometimes called predictive text or suggestive searches, have become commonplace for online search engines and websites. Using this style of query, when a user begins to type a search word, potential results appear as the user types. Coders in prior BPS student interview instruments have required the user to completely type the query and then click “enter” to begin the search.
Predictive search methods for interview coders were tested for the potential to reduce interview burden by decreasing the time required to code data, including major/field of study, postsecondary institutions, and ZIP codes. Testing included comparing administration times for forms using predictive searches with times for traditional, non-predictive searches. The experiment also included comparisons of substantive responses, measured as an item’s percentage of missing data, and the need for post-data collection upcoding, which is a process in which expert coding staff attempt to identify an appropriate standardized response option for any text strings entered by a respondent for which a code was not selected. The following section summarizes the experimental forms, the results of the experiments, and the recommendations for full-scale.
Major/field of study
The non-predictive major/field of study coder (Figure 1) required respondents to enter text strings that were used to perform a keyword search linked to an underlying database. After the respondent typed and submitted the string, the coder returned a series of possible matches for the respondent to review and select from.
Figure
1. Traditional major coder
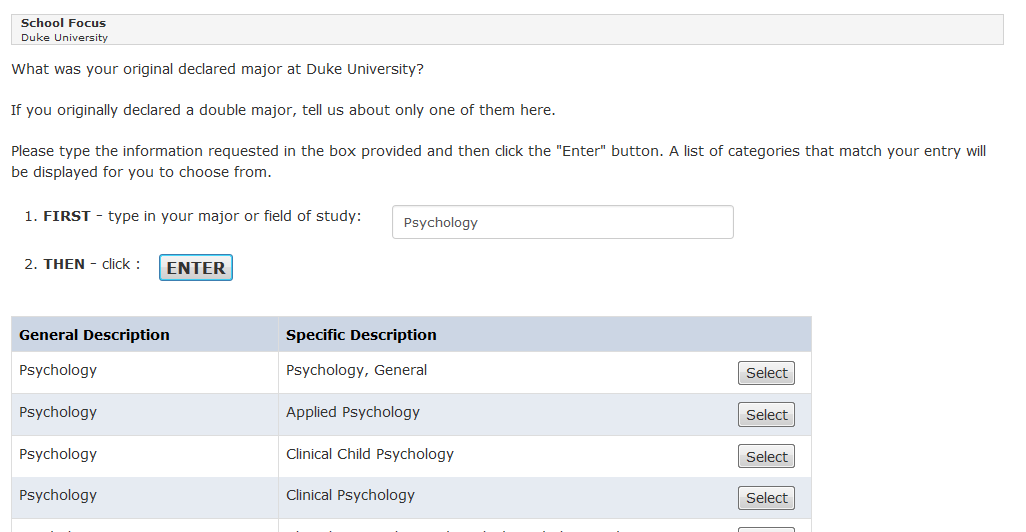
Using the new predictive search coder (Figure 2), when respondents entered three or more characters into the search field, the form immediately displays potential matching results beneath the search field.
Figure 2. Predictive major coder
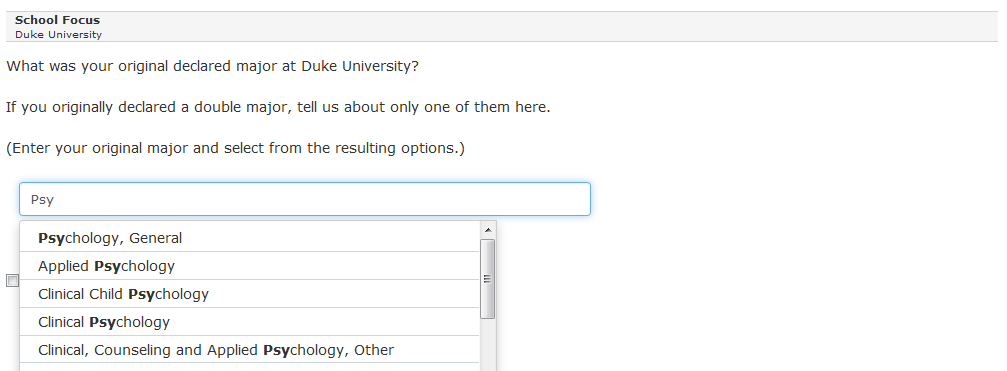
Results. The mean time to complete the experimental form (40.5 seconds) was less than the mean time for the control form (54.3 seconds) (t(835.9) = 3.59, p < .001). The percentage of missing data was not significantly different between the control (18/586 = 3 percent) and treatment (14/577 = 2 percent) groups (χ2 (1, N = 1,163) = 0.24, p = .62). As shown in Table 1, approximately 11 percent of the experimental coder responses required upcoding, compared to 5 percent for the control coder. However, after upcoding, the remaining text strings that could not be upcoded were each approximately 1 percent.
Table 1. Summary of upcoding results, major coder |
|
||
Response Outcome |
Coder Type |
||
Traditional major coder |
Predictive major coder |
||
Total (Number)
Needed upcoding (Percent) |
548
4.2 |
541
11.5 |
|
Successfully upcoded (Percent) Could not be upcoded (Percent) |
3.7 0.5 |
10.4 1.1 |
|
Postsecondary Institution Coder
Similar to the major/field of study coder, the non-predictive search postsecondary institution coder (Figure 3) required respondents to enter text strings that were used to perform a keyword search linked to an underlying database. The coder then returned a series of possible matches for the respondent to review and select from. Using the new predictive search coder (Figure 4), after respondents entered three or more characters into the search field, potential matching results displayed immediately in the search field.
Figure 3. Traditional postsecondary institution coder
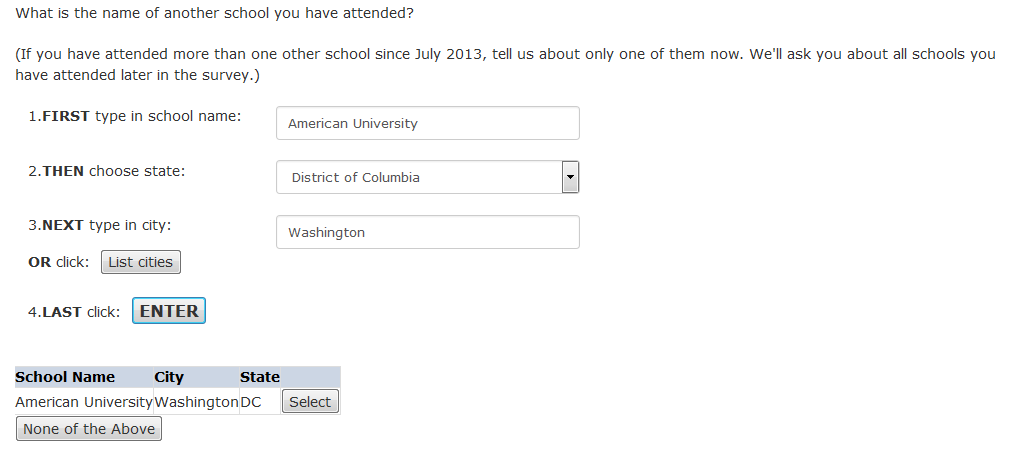
Figure 4. Predictive postsecondary institution coder
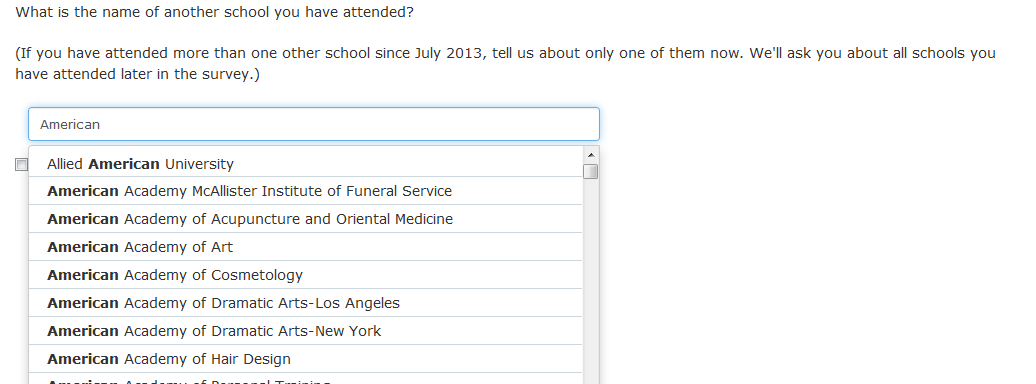
Results. The mean time of the experimental postsecondary institution coder (34.5 seconds) was less than the mean time for the control item (54.7 seconds) (t(242.48) = 2.67, p < .01). Among cases within this analysis, there were not enough missing responses in either group to test for reduction in missingness. Only one respondent in each group skipped the institution coder form. As shown in Table 2, approximately 14 percent of the experimental predictive coder responses required upcoding, compared to 13 percent for the control coder. However, after upcoding, the remaining text strings that could not be upcoded were approximately 5 and 6 percent for the predictive and traditional coder, respectively.
Table 2. Summary of upcoding results, postsecondary institution coder |
|
|||
Response Outcome |
Coder Type |
|||
Traditional institution coder |
Predictive institution coder |
|||
Total (Number)
Needed upcoding (Percent) |
224
12.9 |
181
14.4 |
||
Successfully upcoded (Percent) Could not be upcoded (Percent) |
6.6 6.3 |
9.4 5.0 |
||
ZIP Code Coder
For the traditional ZIP code coder, a 5-digit numeric code was entered by the respondent and matched to a ZIP code database. The control form (Figure 5) required all five digits be entered before executing a search. The predictive search coder (Figure 6) provided the ability to match a partially entered ZIP code to city and state names, resulting in a list of matched ZIP codes from which respondents could more easily select a response.
Figure
5. Traditional Zip code coder
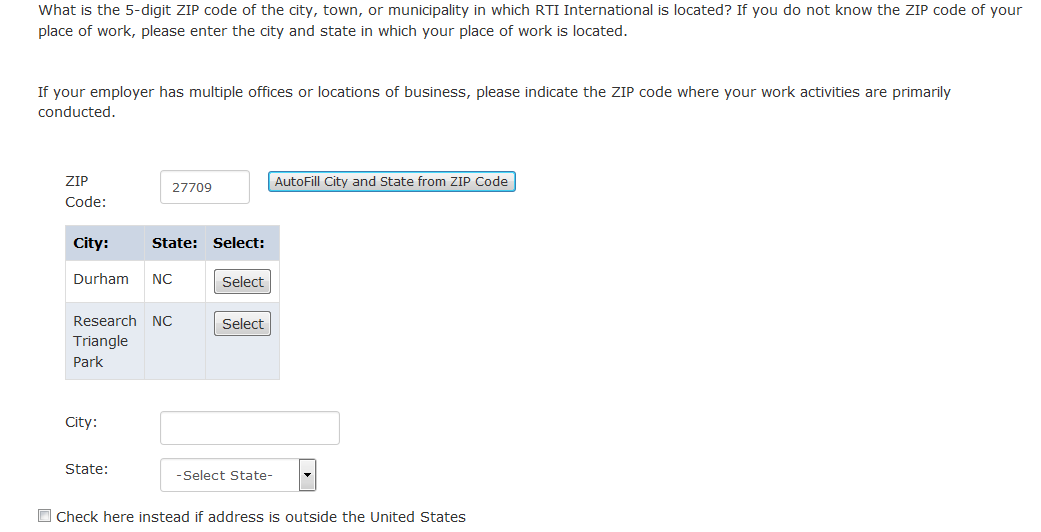
Figure 6. Traditional ZIP Code Coder
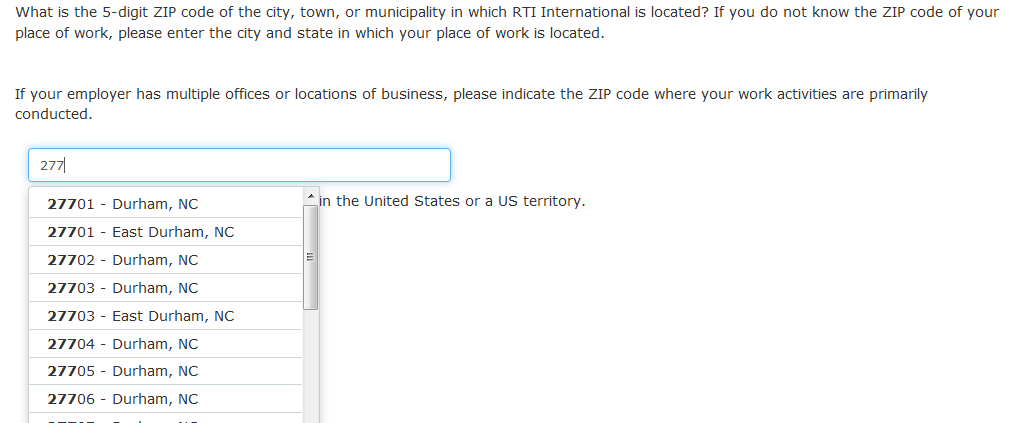
Results. The mean time for the experimental, predictive ZIP code coder (24.3 seconds) was significantly less than that of the control form (33.1 seconds) (t(727.92) = 4.49, p < .001). The percentage of missing data was significantly less for the experimental, predictive ZIP code coder (27/513 = 5.2 percent) compared to that of the control coder (50/505 = 10 percent) (χ2(1, N = 1,018) = 7.18, p < .01). Upcoding was not performed on partial ZIP codes. However, with the predictive search coder, if a respondent entered an entire, 5-digit ZIP code but did not click “enter” to submit the ZIP code, the user-submitted data were added to the data file. Table 3 shows the distribution of ZIP codes results.
Table 3. Summary of results, ZIP code coder |
|
|
Response Outcome |
Coder Type |
|
Traditional ZIP code coder |
Predictive ZIP code coder |
|
Total (Number)
Valid ZIP code provided (Percent) |
902
78.3 |
1,059
86.6 |
Missing ZIP code (Percent) |
12.2 |
6.6 |
Invalid ZIP code provided (Percent) |
9.5 |
6.8 |
Evaluation of revised question wording for grade GPA
Given the sensitive nature of questions related to academic-performance and social desirability of a higher GPA, interview respondents with lower grades may be motivated to inflate their GPA when self-reporting. One approach to mitigate social desirability bias uses a “forgiving” introduction before the question, suggesting normative or otherwise comprehensible behavior (Sudman, Bradburn, and Wansink, 2004). As mentioned by Tourangeau and Yan (2007), few studies have examined the validity of data reported using forgiving wording, and results from those have been mixed, showing no difference or small increases in response to sensitive questions (Holtgraves, Eck, and Lasky, 1997; Catania et al., 1996; Abelson, Loftus, and Greenwald, 1992).
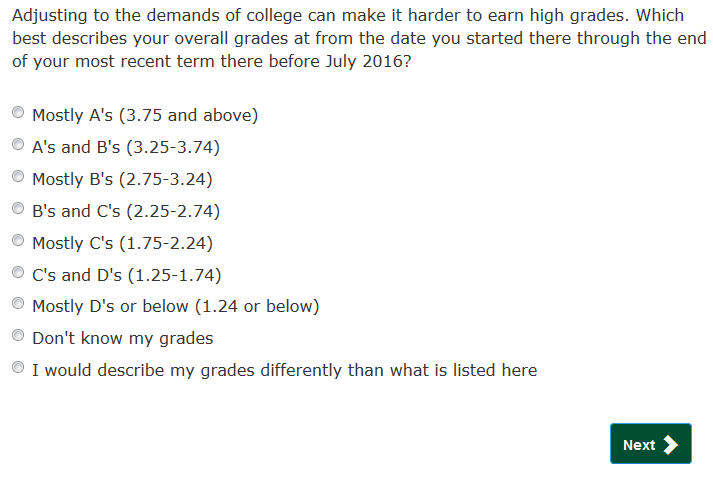
In this experiment, the control group was administered a GPA question, structured similarly to what was used in the prior round BPS:12/14, while the treatment group was administered the same question with a forgiving introduction in question wording. Examples of both the control and treatment question are provided in figures 7 and 8.
Figure 7. Traditional GPA Item
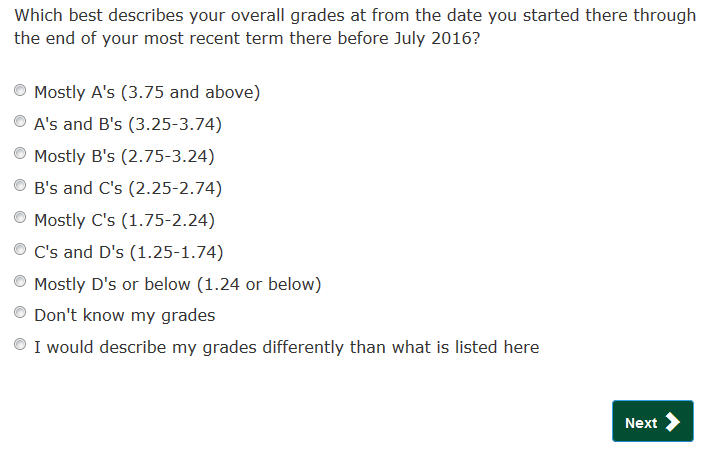
Figure 8. Experimental GPA Item
The research questions for the GPA experiment were 1) what impact will the addition of forgiving language have on GPAs reported; 2) will the addition of forgiving language increase the amount of substantive (i.e. non-missing) responses; and 3) will timing be increased due to the addition of forgiving language? An additional hypothesis was formulated for the first research question, on the impact on GPAs reported, that students with true GPAs of C, D, or F are more inclined to report GPAs of B and above (corresponding to a GPA greater than or equal to 3.25).
Impacts on reported GPAs – Table 4 displays the response distribution among both the control and treatment group. To address the research question regarding impacts on reported GPAs, analyses were restricted to GPA responses on the 0–4.0 scale (i.e. excluding missing, “Don’t know my grades,” and “Describe grades differently”). Value means were found to be lower, but not significantly so, among cases administered the experimental form compared non-experimental cases (t(1057.84) = .49, p = .63). An ordered probit model was also investigated, though no significant differences were detected between the treatment and control group.
Table 4. Response distribution, by control and treatment group
|
Control |
|
Treatment |
||
|
N |
Percent |
|
N |
Percent |
Total |
558 |
100 |
|
556 |
100 |
Missing |
1 |
.18 |
|
0 |
0 |
Mostly A's (3.75 and above) |
105 |
18.82 |
|
104 |
18.71 |
A's and B's (3.25-3.74) |
184 |
32.97 |
|
169 |
30.40 |
Mostly B's (2.75-3.24) |
121 |
21.68 |
|
125 |
22.48 |
B's and C's (2.25-2.74) |
89 |
15.95 |
|
103 |
18.53 |
Mostly C's (1.75-2.24) |
22 |
3.94 |
|
16 |
2.88 |
C's and D's (1.25-1.74) |
10 |
1.79 |
|
8 |
1.44 |
Mostly D's or below (1.24 or below) |
1 |
.18 |
|
3 |
.54 |
Don’t know my grades |
14 |
2.51 |
|
18 |
3.24 |
Describe grades differently |
11 |
1.97 |
|
10 |
1.80 |
To address the research question regarding students with true GPAs of C, D, or F being more inclined to report GPAs of B and above (corresponding to a GPA greater than or equal to 3.25) an indicator variable for values corresponding to a GPA at or above 3.25 was created. This cut point was chosen to ensure the lower grade boundary included Bs. A logistic regression model was then used to examine the likelihood of a student being in the treatment group using the indicator, specified by

where
 is a binary indicator for a student reporting a GPA of 3.25 or
higher. Results, however, indicated that there was no statistically
discernable difference between the treatment and control group. Table
5 shows the results of this model.
Table 5. Logistic regression estimates and odds ratios for treatment group
|
Estimate |
95% confidence interval |
z-score |
p-value |
GPA 3.25 or higher = 1 |
-0.11 |
[-.35, .14] |
-.85 |
.39 |
Intercept |
0.05 |
[-.13, .22] |
.54 |
.59 |
Results. There were insufficient missing data to compare the control and experimental items; only one respondent (in the control group) skipped the GPA form. No significant difference was found between the mean time to complete the control form (16.3 seconds) and the treatment form (18.0 seconds) (t(903.99) = 1.36, p = .18).
Recommendations for full scale
We recommend use of the predictive search coders for the full-scale interview. Each of the three predictive search questions took significantly less time for respondents to complete than the equivalent non-predictive search items. Furthermore, the predictive search forms did not produce greater levels of missing data than the traditional coders. We also recommend using the traditional GPA question wording in the full-scale interview. The experimental GPA question did not result in significantly different substantive responses, did not demonstrate faster administration time, and there was no significant difference in the amount of missing data between the forms.
References
Abelson, R. P., Loftus, E. F., and Greenwald, A. G. (1992). Attempts to improve the accuracy of self-reports of voting. In J. Tanur (Ed.), Questions about questions: Inquiries into the cognitive bases of surveys. (pp. 138–153). New York: Russell Sage Foundation.
Catania, J. A., Binson, D., Canchola, J., Pollack, L. M., Hauck, W., and Coates, T. J. (1996). Effects of interviewer gender, interviewer choice, and item wording on responses to questions concerning sexual behavior. Public Opinion Quarterly, 60, 345–375.
Holtgraves, T., Eck, J., and Lasky, B. (1997). Face management, question wording, and social desirability. Journal of Applied Social Psychology, 27, 1650–1671.
Sudman, S., Bradburn, N.M., and Wansink, Brian. (2004). Asking Questions: The Definitive Guide to Questionnaire Design. (pp. 109–111). San Francisco: Jossey-Bass.
Tourangeau, Roger, and T. Yan. (2007). Sensitive questions in surveys. Psychological Bulletin, 133(5), 859-883.
2012/17 Beginning Postsecondary Students Longitudinal Study: (BPS:12/17)
Appendixes
D
Qualitative Evaluation for Student Records – Summary of
Findings and Recommendations
RTI Project Number
0212353.500.002.237
2012 Beginning Postsecondary Students Longitudinal Study (BPS:12)
Qualitative Evaluation for Student Records – Summary of Findings and Recommendations
August 2016
Prepared for
National Center for Education Statistics
Prepared by
RTI International
3040 Cornwallis Road
Research Triangle Park, NC 27709
Table of Contents
Institution Information Page (IIP) 17
Findings Related to Specific Data Items 19
Appendix A: Recruitment Screener 23
Introduction
This report describes the methodology, procedures, and findings from qualitative evaluation of the 2012 Beginning Postsecondary Students Longitudinal Study (BPS:12) student records instrument. The BPS:12 instrument was built upon the one administered as part of the 2015–16 National Postsecondary Student Aid Study (NPSAS:16), with updates to adapt the instrument for collecting data across multiple academic years. (NPSAS collects data for a single academic year, whereas BPS will collect data for up to 6 academic years.) NCES has implemented an initiative to align the data elements requested from institutions across the postsecondary sample studies to reduce the burden from multiple requests on institutions. This initiative provides additional context for the goals of the evaluation. The results of this evaluation will be used to refine the instrument and ensure consistency in the items collected across studies and between rounds of the same study.
BPS:12 qualitative evaluation was conducted to meet several specific goals: to gather feedback on institutions’ experiences participating in NPSAS:16 and identify opportunities for improving the instrument based on their experiences; to assess the usability of the student records instrument when adapted for a multiyear collection; to identify any challenges presented by collecting data elements across several academic years; and to identify strategies for reducing burden on participating institutions.
Participants were recruited from the pool of institutions that completed the NPSAS:16 student records collection. Participants provided feedback on their comprehension of questions, retrieval of relevant information (including whether they retrieved the data themselves or worked with other departments at the institution), navigation through the instrument, ability to match their responses to each question’s response options, and challenges encountered when completing the NPSAS:16 request.
Methods and Procedures
Recruiting
Participants were recruited from institutions that completed the NPSAS:16 full-scale student records collection and were located within 200 miles of Research Triangle Park, North Carolina. Eligible institutions were contacted by telephone and screened to ensure they met the criteria for participation. Appendix A presents the questions that were used to screen potential participants. These questions were meant to determine whether the prospective participant was knowledgeable about the NPSAS:16 student records collection, remembered the NPSAS:16 collection in sufficient detail to provide feedback, and was available to complete an interview in June or early July of 2016. The selected participant from each institution was the person responsible for providing data for the NPSAS:16 collection.
Recruiting was conducted with a goal of 10 to 12 participating institutions, and a total of 10 institutions were ultimately recruited and interviewed. Participants were offered a $25 Amazon gift card to encourage participation and to thank participants for their time and assistance. Eight participants accepted the gift card and two participants declined. The final set of participating institutions represented a range of institution types, sizes, and data collection modes. Table 1 describes the characteristics of the recruited institutions.
Table 1. Characteristics of BPS:12 Qualitative Evaluation Participating Institutions
Qualitative Evaluation Interview Session |
Institution Type |
NPSAS:16 Student Records Sample Size (rounded) |
NPSAS:16 Student Records Mode |
6/14 |
Private nonprofit 4-year non-doctorate-granting |
20 |
Excel |
6/15 |
Public 2-year |
40 |
Excel |
6/16 |
Public 2-year |
40 |
Excel |
6/17 |
Public 2-year |
40 |
Excel |
6/20 |
Private nonprofit 4-year doctorate-granting |
40 |
Excel/Web |
6/22 |
Public 2-year |
50 |
Web |
6/27 |
Private nonprofit 4-year doctorate-granting |
50 |
Excel |
6/27 |
Public 4-year doctorate-granting |
120 |
CSV |
6/28 |
Private nonprofit 4-year doctorate-granting |
200 |
Excel/CSV |
7/1 |
Public 4-year doctorate-granting |
130 |
Excel/CSV |
Interview Protocol
Ten interviews were conducted between June 14 and July 1, 2016. Before each scheduled interview, the project team sent a confirmation e-mail to each participant with information about the upcoming session and a copy of the consent form. The confirmation e-mail and consent form sent to participants are included in Appendix B.
A member of the project team visited each institution and conducted the interview sessions in person. Before beginning the interview, participants were asked to read and sign the consent form and to verbally consent to audio recording of the session. All participants consented to the audio recording. After the sessions were completed, the audio recordings were edited to remove identifying information and were then used to prepare notes from each session.
Interview sessions lasted approximately 90 minutes. During the interview, participants were asked to log in to the web-based instrument and navigate through each of the steps in the student records collection process: the Institution Information Page; the Enrollment by Year page; the web mode page; and the Excel template, which was provided for participants to view offline. The interviewer observed the participants as they navigated through the instrument and solicited feedback based on a predetermined list of discussion topics. The interview protocol guide, including the list of discussion topics, is presented in Appendix C. Participants were asked for their feedback concerning the availability and accessibility of the requested data for multiple academic years and the anticipated burden required to complete the request. The section below provides additional details about the topic areas discussed.
Institution Information Page
Each participant was asked to log into the Postsecondary Data Portal page and review the Institution Information Page (IIP). The IIP is a preliminary step that institutions complete prior to providing student records data. In NPSAS:16, the primary function of the IIP is to collect information about the institutions’ term structure, which is used later in the instrument to collect enrollment status data for sampled students. For BPS, this section was expanded to accommodate a multiyear collection. The interviewer guided participants through the IIP, pointing out areas that have been changed since NPSAS:16 and probing for feedback on each item. This discussion included review of three new items, shown in Exhibit 1.
E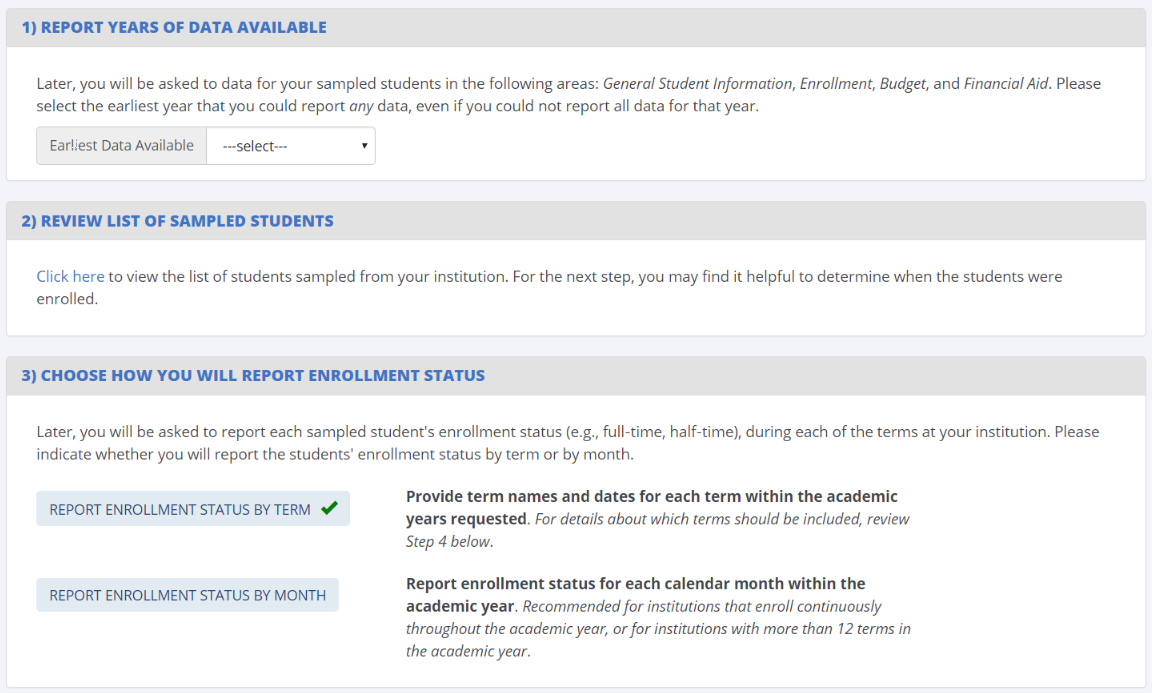
xhibit
1. New Institution Information Page Items
In addition to these new items, participants reviewed the “Provide Terms” section, shown in Exhibit 2, which uses the same design as NPSAS:16. Participants were asked for feedback about their experiences providing terms for NPSAS:16 and the updates made to collect terms for multiple academic years.
E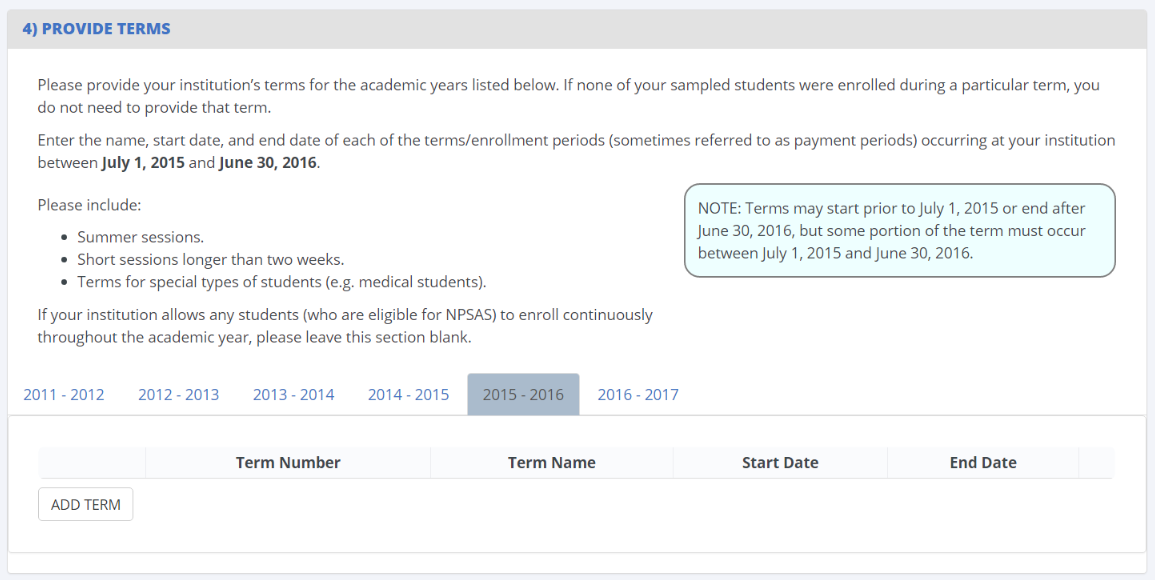
xhibit
2. Providing Terms
Enrollment by Year Page
The Enrollment by Year page was added for BPS and is designed to collect the academic years in which sampled students were enrolled. This information will be used to filter items later in the instrument. For example, if an institution reports that a student was not enrolled in the 2016–17 academic year, the institution will not be prompted to provide that student’s data for 2016–17 downstream in the instrument. The Enrollment by Year page is shown in Exhibit 3.
E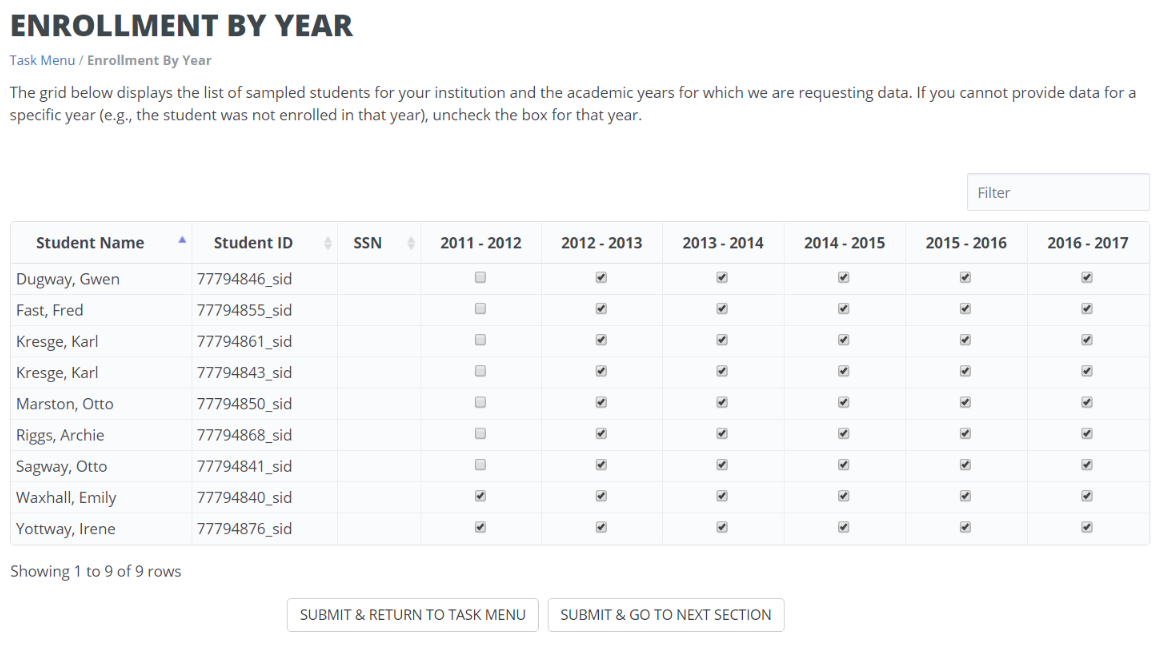
xhibit
3. Enrollment by Year Page
Web Mode Page
During the interview, the interviewer guided each participant through the web mode page. Most participants selected Excel or CSV mode and therefore had not seen the web mode page prior to the interview. Participants were asked for their feedback and impressions about the web mode data entry page, such as the usability of the data entry tools, their reasons for choosing or not choosing the web mode option, and how likely or unlikely they were to use web mode in the future.
As the participant scrolled through the web mode page, the interviewer guided a discussion of the items collected in each data section, probing for any challenges encountered during NPSAS:16 and any anticipated challenges providing data for multiple years.
Excel Mode Template
Prior to the interview session, each participant was provided with a sample Excel template by e-mail. The layout and design of the template closely mirrored the template used during NPSAS:16. The interviewer encouraged participants to scroll through the template and provide feedback on updates to adapt the template for collecting multiple years of data. Participants were specifically asked to consider how easy or difficult it would be to track their progress completing the template and to provide feedback on the process for excluding students who were not enrolled in a particular academic year. For participants who used the Excel template during NPSAS:16, the interviewer also asked debriefing questions about their experiences, challenges, and suggestions for improvement.
CSV Mode
For institutions that provided data using CSV mode or downloaded the CSV specifications file, participants were asked to provide feedback on the file specs document and the ease of providing data in the formats requested, describe their strategies for pulling data from their data management systems, report any challenges encountered while providing data for NPSAS:16, and talk through any challenges they anticipated for providing multiple years of data.
Other Topics
Participants were encouraged to provide any additional feedback about the instrument or their experience participating in NPSAS:16 beyond those topics already discussed during the interview.
Findings
This section presents the findings from the qualitative evaluation, as well as a description of proposed changes.
Institution Information Page (IIP)
Each participant was asked to describe the term structure at their institution and then to describe the term data they provided for NPSAS:16. This discussion revealed several complexities relevant to the collection of term data, particularly those related to “mini-sessions” (shorter class periods that fit within standard academic terms). The most common scenario was one in which a standard semester-based academic year with a 16-week fall and spring semester was divided into smaller 8-week blocks. Thus, the fall semester could have full-term 16-week courses, or shorter courses that were taught in one of two 8-week blocks. Universally, participants considered these shorter courses to be part of the larger semester and did not report these terms for NPSAS:16. In fact, the institutions did not always treat these mini-sessions as individual terms in their own systems. Upon further probing about how participants interpreted the instructions on the “Provide Terms” item, several participants reported that they would not be able to report enrollment status at the level of the mini-session, even if they had reported the mini-sessions as individual terms. They noted that their data systems do not distinguish between enrollment in one block of courses and another within the same semester and that, if the purpose of this section is to facilitate the collection of enrollment data, they would only be able to provide the larger terms. Overall, participants noted that it is not common for students to be enrolled in one block of courses within a term but not another block (due in part to the fact that institutions generally treat the entire semester as one payment period) and that including the mini-sessions would be unlikely to change the reported enrollment patterns of individual students.
Some participants did express confusion about how to report summer sessions when the term dates overlap the start of the NPSAS year. It is common for institutions to have two summer sessions, which typically correspond to May–June for Summer I and July–August for Summer II, while other institutions may have summer sessions that span across two NPSAS years (such as those that begin in June but end in July). Additionally, there is some variation in whether these terms are considered to be part of the same academic year, even within the institution. One participant noted that the dividing line between years falls differently within her institution depending on whether one is asking about the fiscal year, the enrollment year, the financial aid year, or the institutional budget year. To clarify how summer sessions should be reported, the help text will be updated to include an example of a common two-session summer-term schedule and how those terms should be reported in the instrument.
Overall, participants responded favorably to the changes designed to adapt the Institution Information Page for multiple years. No institutions expressed concern about being able to provide term data for up to 6 years, with some participants mentioning that the term date information could be retrieved from past academic catalogs. Participants specifically complimented the new option to explicitly choose between reporting enrollment status by term and by year (step 3 on the IIP), with some participants reporting that they did not realize there were two options for reporting enrollment status in NPSAS:16. These participants noted that the new layout clarified the options, and they reported that it would be easy for them to choose between the two options.
For collecting multiple years of term data, the existing fields were duplicated using horizontal tabs, with the 2011–12 year on the left and the 2016–17 year on the right. Participants were able to navigate the instrument and enter terms without instruction and, when prompted for feedback on the design, the participants generally agreed that the new design was intuitive. One participant noted, “I instinctively knew to click on [the tab] and go to the next one.” This section will be updated to improve the visual distinctiveness of the tabs and help them stand out from the page background, but there are no planned changes to the basic functionality of this section.
Enrollment by Year Page
In general, participants found the proposed Enrollment by Year page intuitive to use and easy to understand. Without prompting, participants began examining the list of students and toggling check boxes, suggesting that users find the functionality of the page to be apparent without instruction. Probing by the interviewer revealed that more detailed instructions should be added to clarify the definition of “enrolled” for nontraditional students, such as students on leave for military service or students completing dissertation research but not enrolled in coursework. Participants from larger institutions noted that the time to complete the page would be reduced with the addition of a “select/unselect all” option and an option to download a list of their sampled students in Excel format, both of which will be added to the instrument.
Web Mode Page
Participants responded favorably to the web mode page. Participants who used web mode during NPSAS:16 noted that it was easy to use and reported no significant problems. One participant noted that he preferred web mode because it was easy to provide the data using the on-screen tools, and he didn’t have to worry about using the correct data formats. Another participant reported that it was convenient to use web mode to make data edits after uploading an Excel template. Participants who had not used web mode previously found it easy to navigate and stated that they would be likely to use web mode in a future study if the student sample were smaller than NPSAS:16.
Participants also responded favorably to the tabbed layout of the multiyear data elements; a few participants commented that they liked the consistency between the IIP and web mode pages, which both use tabs to toggle between academic years. The web mode page will be updated to make the tabs more visually distinct, consistent with planned changes to the IIP, but no changes to the functionality of the web mode page are recommended at this time.
Excel Mode Template
In general, participants found the Excel template to be intuitive and easy to use. When asked about the most useful features of the template, participants noted the highlighting of alternating rows, color-coding of column headers, having help text listed both in a separate tabs and in column headers, and the ability to work on the file offline.
Participants also found the multiyear template easy to navigate. Participants liked the grayed out and locked cells that were used to indicate years for which data was not needed (e.g., years in which the student was not enrolled at the institution). As participants scrolled through the columns for each academic year, some participants hesitated and scrolled back and forth. When questioned by the interviewer, these participants noted that there were numerous columns and it could be difficult to keep track of which academic year was selected. The template will be revised to improve the navigability of the multiyear sections, such as improving header labels and color-coding column headers by academic year.
Some participants noted that there was no external and comprehensive list of the data elements requested in the template and stated that they downloaded and used the CSV specs as a “cheat sheet” when they were pulling data from their systems for NPSAS:16. This practice presented some challenges because there are inherent differences between the two modes that would prevent institutions from being able to copy and paste their entire data pull from CSV files into the Excel template. The interviewer proposed that the Excel template could be updated to include a data dictionary, which would list every item from the Excel template and the valid response options and data formats for each item. Participants agreed that this document would make it easier for them to pull data from their systems and to communicate with other offices about what data elements are needed. The BPS template will be updated to include a data dictionary tab, which will also be developed into a document that can be provided to the institutions separately from the Excel template.
CSV Mode
One participant had provided CSV data for several rounds of NPSAS and described her process for pulling the data from her institution’s data management system. She began with the programs she had written to provide data for NPSAS:12 and compared her NPSAS:12 code to the file specifications for NPSAS:16. She then updated each of her NPSAS:12 programs to conform to the updated NPSAS:16 specs. When probed by the interviewer, she agreed that a document detailing the spec changes since the last round of NPSAS would have reduced the burden of the request for NPSAS:16 and that she would not be concerned about providing 6 years of data because she could use the same programs she wrote for NPSAS:16. Incorporating this feedback, the BPS file specifications document will include a detailed list of differences between BPS and NPSAS:16, eliminating the need for institutions to spend time comparing their existing programs to the latest request.
Findings Related to Specific Data Items
Marital Status. Several participants identified this item as one for which they often have poor coverage in their data management systems. They reported they had no trouble accurately reporting the data when it is available in their records and that, when the data are not available, they reported the students’ marital status as “Unknown” without difficulty. No changes to this item are recommended at this time.
Veteran’s Status. A few participants reported that they could provide this data without difficulty, but, upon further probing, noted that they determined a student’s veteran status based on whether he or she was receiving veteran’s benefits. Because a student may be receiving benefits as the spouse or child of a veteran when he or she is not a veteran, we propose to clarify the help text on this item to specify the difference between this item (which collects the sample member’s veteran status) and the Veteran’s Benefits item in the financial aid section (which collects the amount of veteran’s aid received, regardless of whether the sample member is a veteran).
Race/Ethnicity. Institutions noted that this item is consistent with the way they collect race and ethnicity from students but differs from the racial categories reported to IPEDS. To address institutions’ concerns about this difference and avoid confusion, we propose to include help text that includes information about the differences between the NPSAS and IPEDS race and ethnicity reporting categories.
Test score. This series of items was added to the instrument between the NPSAS:16 field test and full-scale collections, so the qualitative evaluation provided an opportunity to solicit feedback about them. Participants unanimously agreed that they had no problems reporting these items. Several noted that their institutions are test-optional but that, when ACT or SAT scores are reported by the student, they had no difficulty providing them for NPSAS. No changes to these items are recommended at this time.
Transfer credits. Participants reported no difficulty determining whether students had transferred credits from another postsecondary institution and were able to exclude credits earned by exam (such as Advanced Placement credits), as specified in the help text. One participant noted that the help text does not specify whether remedial courses should be included; therefore, the help text will be revised to specify that remedial courses should be excluded.
Remedial courses. Participants noted that it is straightforward for them to determine whether a student has taken remedial coursework at their own institution but that their systems do not reliably store whether a student had taken remedial coursework at a prior institution. One participant explained that, because a student could not transfer remedial coursework for credit, they would not have a record of the course in their system. However, all of the participants were satisfied with the response options available to them (Yes, No, and Unknown). No changes to this item are recommended at this time.
Degree program. No participants reported any challenges providing this data for NPSAS:16. They noted that, for students enrolled in multiple programs, the help text provided sufficient guidance for them to determine which program to report.
The NPSAS:16 help text instructed the institutions to provide the student’s degree program “during his or her last term at [institution] between July 1, 2015 and June 30, 2016.” The interviewer reminded participants of this instruction and asked them to consider how this item should be adapted for collecting students’ degree programs in past years. Participants agreed that, because students can change programs at several points throughout the year, the help text should specify to provide the student’s degree program at a single point in time and not ask for the degree program “during the 2011–2012 academic year” more generally. Participants agreed that they would be able to provide this item as of June 30 in each academic year, although there was some variation in the level of effort required to provide this data.
Some participants noted that their data is archived at specific points in the term. On a periodic basis, these institutions record a “snapshot” of their enrollment data as of their enrollment census date, which is stored for later reference. Institutions varied in the frequency with which they record these snapshots, with some institutions recording them once per term and other institutions recording them monthly. Participants reported that they could provide the student’s degree program as of the closest snapshot date without difficulty. If this date were far removed from the date requested in the BPS instrument, these participants reported they could retrieve the requested information by reviewing students’ transcripts or could provide data as of the last term enrolled prior to June 30. The help text for this item will be revised to clarify time period requested, such as, “In what degree program was this student enrolled at [institution] on June 30, [year]? If the student was no longer enrolled on June 30, [year], report the degree program for his or her last term at [institution] between July 1, [year] and June 30, [year].”
Class level. For class level, participants from 2-year institutions noted that the response categories (freshmen, sophomore, etc.) seemed oriented toward 4-year institutions and were not as applicable to their institution, in which many students are enrolled part time and complete their program over the course of several years. All of these participants noted that they were able to determine class level based on credit hours completed and that the guidance provided in the help text, which included a common student classification based on credit hours, was helpful for determining students’ class levels for NPSAS:16.
The discussion also covered the potential complexities of collecting class level for past academic years. The participants noted that the challenges of providing degree program, as noted above, would apply to the other items in the enrollment section: class level, GPA, major, and enrollment status. A few participants additionally noted that they could closely estimate class level as of June 30 by combining the class level as of their most recent data snapshot with the number of credits enrolled after the snapshot. All participants were confident that they could directly report or accurately estimate students’ class levels as of June 30 in each academic year. The help text for this item will be updated to mirror the time period specified in the help text for Degree Program.
Credit/Clock Hours Required for Program & Cumulative Credit/Clock Hours Completed. For this item, participants expressed similar concerns as those reported for degree program and class level: the need for a specific “as of” date and the fact that data would be recorded in periodic snapshots. Participants noted that the strategies used to identify students’ class levels as of June 30 could also be used to estimate their cumulative hours completed and that they would be reasonably confident about the accuracy of these estimates. The help text will be updated to be consistent with the degree program and class level items, instructing institutions to provide data as of June 30 in each academic year.
Enrollment Status. The response options for enrollment status are not enrolled, full-time, ¾-time, half-time, or less than half-time. Some participants noted that their institutions use designations for full-time or part-time but nothing more specific for part-time students. Upon probing, these participants noted that they successfully mapped their data onto the categories provided by using the credit hour guidelines in the help text.
Participants reported that providing data for past academic years would not be substantially more difficult than providing the data for the NPSAS year, but some participants reiterated that their data is archived at specific points in the term. These participants reported that they would be able to provide enrollment status as of this census date but may not be able to capture other changes throughout the semester. For example, if a student were attending full-time on the census date but dropped to part-time later in the semester, the institution could only report that student as full-time. This approach is consistent with the instructions provided for NPSAS, which aims to collect enrollment status based on the number of hours attempted in the semester. If a full-time student were to withdraw from a course after the institution’s drop/add deadline, which is usually aligned with the census date, the institution should report that student’s enrollment status as full-time. Therefore, no changes to the enrollment status item are recommended at this time.
Budget. Help text in the budget section notes that the institution should provide a student’s individualized budget and not a generic budget. Several participants noted that their institution does not prepare an individualized budget for students who have not applied for aid and expressed confusion about what to report in this section for unaided students. One participant noted, “We could give you an estimated cost of attendance, but your instructions say not to provide a generic budget. It would be good to know how to proceed with budget and cost of attendance.” While the individualized budget is still preferable, the help text will be revised to provide instructions for institutions that can only provide a generic budget or an estimated cost of attendance.
Participants also expressed some confusion about the budget period item, specifically regarding what to select when the student’s budget does not match his or her enrollment status (e.g., an institution may have prepared a budget based on anticipated full-time enrollment, but the student then drops to part-time status) or when the student changes status from one term to the next within the same academic year. The help text will be revised to provide institutions with guidance for these situations by specifically noting that the budget reported for the student does not have to match his or her enrollment patterns as long as the budget amounts are consistent with the budget period indicated.
Financial Aid. Most participants represented offices of institutional research and reported that the financial aid section was completed by staff from their institution’s financial aid department. Participants reported no significant challenges providing financial aid data for NPSAS:16 collection and noted that the financial aid staff did not need to ask many clarifying questions about the data requested. Participants were generally confident that the financial aid office could provide multiple years of data and did not have feedback on areas for potential improvement. No changes to the financial aid section are planned at this time.
Other findings
Overall, participants responded favorably to the instrument and the prospect of providing up to 6 years of student records data. Participants acknowledged that there would be more effort involved in providing data for past academic years but felt this additional burden was balanced by a smaller student sample size in BPS than in NPSAS:16. Participants noted that they would prefer to have more advanced notice of the data elements that would be requested for the student records component and suggested that a list of the items be provided in the packet with their initial data request. This would allow institutions to begin coordinating with other institution offices and identifying data sources at their convenience, before the student records data collection period, and would help to alleviate some of the additional burden presented by the multiyear data collection. The data dictionary, noted above in reference to the Excel template, would meet this need. For BPS, this data dictionary will be provided to institutions as early as possible in the data collection process.
Appendix A: Recruitment Screener
RESPONDENT NAME: ___________
DATE SCREENED: ________________________
SCREENED BY: ___________________________
DATE OF INTERVIEW: ____________________
(ASK TO SPEAK TO PERSON ON THE LIST)
Hello, this is [name] calling from RTI International, on behalf of the National Center for Education Statistics (NCES) part of the US Department of Education.
We are requesting the help of individuals at postsecondary institutions that have participated in a past round of the National Postsecondary Student Aid Study, or NPSAS. We would like your institution to help us test the website that we use to collect data.
Please note that all responses that relate to or describe identifiable characteristics of individuals may be used only for statistical purposes and may not be disclosed, or used, in identifiable form for any other purpose except as required by law (20 U.S.C., § 9573).
I would now like to ask you a few questions:
Are you familiar with the NPSAS student record collection?
-
CIRCLE ONE
Yes
1
(CONTINUE)
No
2
(Briefly describe the student records collection in NPSAS/BPS, then CONTINUE)
The interviews will be conducted with individuals who are responsible for collecting data from their institution’s records and completing reporting requirements for NCES studies. Which of the following best describes who, within your institution, is responsible for providing the student records data?
|
|
CIRCLE ONE |
|
|
You are the primary person responsible for completing the instruments |
1 |
|
|
You share the tasks involved in completing the instruments with someone else |
2 |
|
OR |
Someone else is involved in completing the instruments |
3 |
(ASK TO SPEAK TO THIS PERSON) |
(DO NOT READ) |
Don't know |
4 |
(THANK AND TERMINATE) |
During the interview session, you will navigate through the website while the interviewer asks you questions. You will need to be sitting at a computer with an internet connection during the interview session. Is there a location at your institution that we could conduct the interview?
-
CIRCLE ONE
Yes
1
(CONTINUE)
No
2
(THANK AND TERMINATE)
[If institution participated in NPSAS:16 student records collection] Which mode did your institution use to complete the NPSAS:16 student record collection?
-
CIRCLE ONE
Web mode
1
Excel template
2
CSV mode
3
Please verify that your institution is still classified as [institution type].
-
CIRCLE ONE
Public less-than-2-year
1
Public 2-year
2
Public 4-year nondoctorate-granting, primarily sub-baccalaureate
3
Public 4-year nondoctorate-granting, primarily baccalaureate
4
Public 4-year doctorate-granting
5
Private nonprofit lt 4-year
6
Private nonprofit 4-year nondoctorate
7
Private nonprofit 4-year doctorate-granting
8
Private for profit less-than-2-year
9
Private for profit 2-year
10
Private for profit 4-year
11
What is your current title? _______________________________________
What department do you work in? (DO NOT READ)
-
CIRCLE ONE
Financial aid/Financial planning
1
Institutional research
2
Admissions
3
Other (Specify) ____________________
4
INVITATION
We would like to invite you to participate in an in-person interview session to discuss ways to improve the student records collection instruments and processes for upcoming studies. You will receive a $25 Amazon.com gift certificate as a token of thanks for your participation in this study. Would you be willing to participate?
-
CIRCLE ONE
Yes
1
(CONTINUE)
No
2
(THANK AND TERMINATE)
When are you available to participate in the interview?
_______________________________________ (DATE)
_______________________________________ (TIME)
Where will the interview session take place? [Request the street address, parking information, campus security info, or other instructions as appropriate.]
_______________________________________________________ _______________________________________________________ _______________________________________________________ _______________________________________________________ (OFFICE LOCATION)
Please provide your e-mail address
_______________________________________ (RECORD E-MAIL ADDRESS)
Please provide a telephone number where you can be reached on the day of the interview.
_______________________________________ (RECORD TELEPHONE NUMBER)
THANK YOU FOR YOUR PARTICIPATION. WE WILL SEND YOU A CONFIRMATION EMAIL.
Appendix B: Confirmation Email and Consent Form
Confirmation Email
[Name],
Thank you so much for agreeing to participate in our upcoming interview about the Beginning Postsecondary Students Longitudinal Study (BPS) student records collection. To confirm, the session will be on [Date] at [Time] and will last about 90 minutes.
The purpose of the interview is to get your feedback on ways to improve the procedures and systems that will be used to collect student records for the BPS study. During the session, I will sit with you while you click through the data collection website on your computer and I will ask you some questions that are intended to help us improve the website. I will also ask you about your recent experience on the National Postsecondary Student Aid Study (NPSAS).
Here is the web address for the site we will be using during the session: https://postsecportalstage.rti.org/. Please have this link handy when we start the session. We will also talk through the Excel template version of the website, which I have attached to this message. I will also bring a copy on a USB memory stick as a back-up.
Prior to the start of the session, I will ask you to sign the research consent form. I have attached a copy of the form to this email so that you can have it for your records.
Your participation in this study is completely voluntary, but we greatly appreciate your willingness to help improve our systems. [As a token of our appreciation, you will receive a $25 gift certificate from Amazon.com after completion of the interview.]
If you have any questions, you can reach me at [number] or [email]. If you need to reach me [Day] before the session, please feel free to call my mobile phone at [number].
Thanks, and I look forward to meeting you!
Jamie Wescott
BPS Project Team
Consent Form
Consent to Participate in Research
Title of Research: Beginning Postsecondary Students Longitudinal Study (BPS): Student Records Interview
Introduction and Purpose
You, along with participants from other institutions, are being asked to participate in a one-on-one interview session being carried out by RTI International for the National Center for Education Statistics (NCES), part of the U.S. Department of Education. The purpose of the session is to interview institution staff experienced with the student record collection for discussion of data availability, collection methods, and usability of the application. The results of these interview sessions will be used to improve student records collection instruments for future NCES studies.
Procedures
You are one of approximately 12 individuals who will be taking part in this study. Participants from other institutions will be asked similar questions.
The interview session will be audio recorded to make sure we don’t miss anything that you say and to help us write a report summarizing the results of the discussions. Upon completion of the written report, the recording will be destroyed. Your name will never be used in the report that we write.
Study Duration
Your participation in the interview session will take about 90 minutes.
Possible Risks or Discomforts
We do not anticipate that any of the discussion topics will make you uncomfortable or upset. However you may refuse to answer any question or take a break at any time.
Benefits
Benefits to you: [You will receive a $25 Amazon.com gift certificate as a token of thanks for your participation in this study.]
Benefits to others: We hope that these interview sessions will help us improve student records collections for future NCES studies that will aid in understanding students’ college experiences and how they pay for college or trade school.
Confidentiality
RTI International is carrying out this research for the National Center for Education Statistics (NCES) of the U.S. Department of Education. NCES is authorized to conduct this study under the Education Sciences Reform Act (20 U.S.C., § 9543). Your participation is voluntary. Your responses are protected from disclosure by federal statute (20 U.S.C., § 9573). All responses that relate to or describe identifiable characteristics of individuals may be used only for statistical purposes and may not be disclosed, or used, in identifiable form for any other purpose except as required by law.
Your Rights
Your decision to take part in this research study is completely voluntary. You can refuse any part of the study and you can stop participating at any time.
Your Questions
If you have any questions about the study, you may call Jamie Wescott (919-485-5573) or Kristin Dudley at RTI International (919-541-6855). If you have any questions about your rights as a study participant, you may call RTI’s Office of Research Protection at 1-866-214-2043 (a toll-free number).
YOU WILL BE GIVEN A COPY OF THIS CONSENT FORM TO KEEP.
Your signature below indicates that you have read the information provided above, have received answers to your questions, and have freely decided to participate in this research. By agreeing to participate in this research, you are not giving up any of your legal rights.
_____________________________________
Signature of Participant
____________________________________ __
Printed Name of Participant
________________ Date
I certify that the nature and purpose, the potential benefits, and possible risks associated with participating in this research have been explained to the above-named individual.
_____________________________________ _
Signature of Person Obtaining Consent
____________________________________ __
Printed Name of Person Obtaining Consent
______________ Date
Appendix C: Interview Protocol
The guide below lists the topics to be discussed with each participant as they navigate the student records instrument. The interviewer will use the sample probes below to guide the discussion of each topic.
Session date & time |
|
NPSAS:16 participant? |
|
NPSAS:16 mode |
|
NPSAS:16 sample size |
|
Introduction (~5 minutes)
Review consent form (signed by participant prior to interview)
Begin audio recording (permission for audio recording will be obtained ahead of time, but ask participant to confirm)
Interviewer: introduce yourself and your role on the project
Purpose of BPS, how it relates to NPSAS
Describe multi-year student records collection and how it differs from NPSAS
Purpose of interview (<5 minutes)
Participants will help us to evaluate the usability of the data collection website
Participants will navigate the site while the interviewer asks questions
Participant Introduction (<5 minutes)
Title and job responsibilities
How long working at current job/in this field
Prior experience providing student records for NPSAS
Participant’s role on NPSAS:16
Did one person complete all sections, or were some sections be completed by staff from other departments? (Which departments?)
Introduce data elements (~15 minutes)
Show participants a list of the data elements that will be requested.
Indicate the items that will be requested once per student and the items that will be collected for each academic year.
Brief overview of multi-year items.
Explain that we will talk through the items section-by-section once we get into the website.
Brief tour of Postsecondary Data Portal (~5 minutes)
Prompt participant to go to https://postsecportalstage.rti.org (link sent by email ahead of session) and log in to test school #1.
Discuss Task Menu, steps in the data collection process
Discuss the Institution Information Page (~15 minutes)
Introduce the Institution Information Page (IIP), remind participant how it worked for NPSAS:16

Discuss purpose of collecting this information (to collect enrollment data later in the instrument)
Discuss sections of data requested
Probe for how many years of data the institution could provide; would it differ by data section?

Discuss list of sampled students and purpose of providing it here. Would the school find this useful?

Is it clear that the institution has two options?
Based on these instructions, which option would the institution choose?
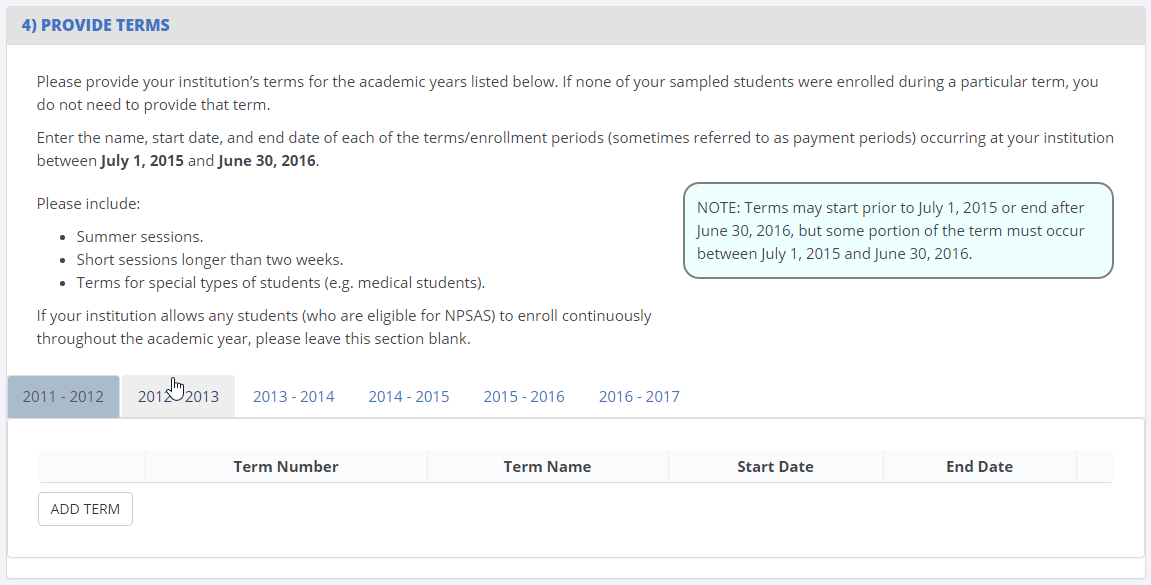
Probe how institutions would provide this information:
Discuss number of terms that would fall under this definition. Did they have trouble with this section for NPSAS:16?
Probe for perceived burden involved in providing multiple years of term data.
Compare perceived burden for providing terms vs. reporting enrollment month-by-month.

Any challenges completing this item for NPSAS:16? Any questions about this item?
Review Enrollment by Year (~5 minutes)

Prompt participant to log out of test school #1 and log in to test school #2.
Explain purpose of the enrollment by year page
Does the school understand how the grid works?
Any changes they would make to this page?
Any more PII that would be needed to identify students?
Mode options (~5 minutes)
Prompt participant to log out of test school #2 and log in to test school #3.
Review the 3 data collection modes available to institutions: Web, Excel, CSV. (Today we’re going to talk about web and Excel modes)
Discuss reasons that the school chose [selected mode] for NPSAS:16/NPSAS:12
Prompt institution to indicate which mode they would choose for BPS, assuming a sample size of [X] students.
Web mode (~15 minutes)
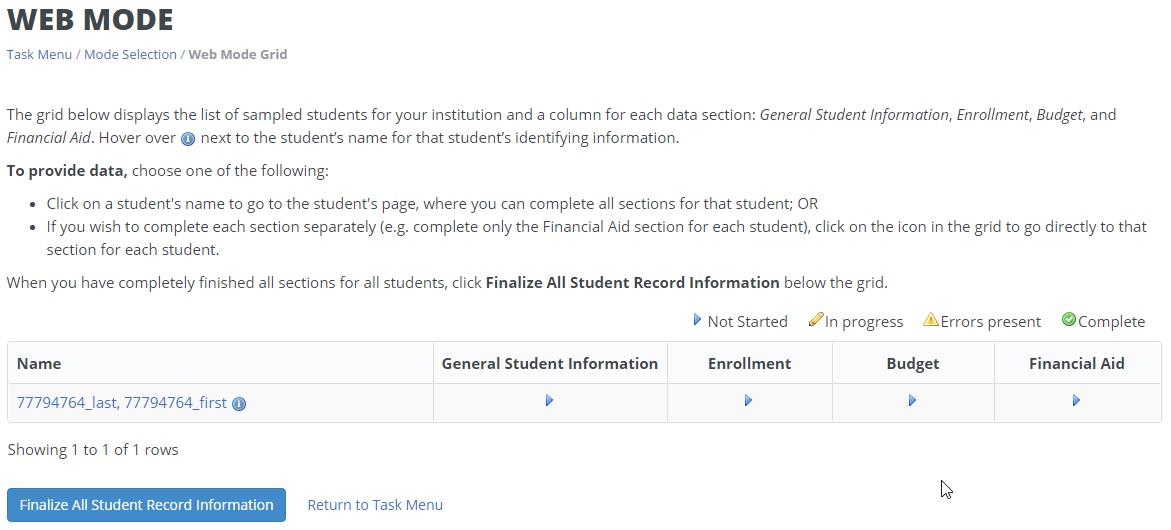
Discuss usability of the web mode grid based on their experience from NPSAS:16 (if applicable)
How easy or difficult is it to navigate the page using the links in the grid?
How easy or difficult is it to track which students are complete?
Are there any changes that would make the grid easier for you to use?
Discuss process for entering data
How easy or difficult is it to identify which data elements should be provided for more than one academic year?
How easy or difficult is it to move from one academic year to another?
How easy or difficult is it to indicate that a student was not enrolled during an academic year?
Are there any changes that would make this page easier to use? How about quicker to use?
Questions about specific data elements (~15 minutes)
General Student Information
Any items that were challenging for NPSAS:16?
Specifically probe for how they approached the marital status, citizenship status, and veteran status items.
Enrollment
Any items that were challenging for NPSAS:16?
If another department completed this section, did they ask you any questions about the items?
Initial enrollment – any concerns about answering these items for up to 6 academic years?
Is it clear where the multi-year items start? Any difficulty navigating from year to year?
Degree program, class level, GPA, credit hours required/completed – could you answer these questions about each academic year?
Could you answer these items “as of June 30, 20XX?” If not, what could you provide?
Enrollment status – any difficulty providing this for NPSAS:16? Any concerns for multi-year?
If not already mentioned, what data management program does the institution use? (e.g., Colleague, Banner, Peoplesoft)
Budget
Any items that were challenging for NPSAS:16?
If another department completed this section, did they ask you any questions about the items?
Any concerns about providing this data for 6 years?
Financial Aid
Any items that were challenging for NPSAS:16?
If another department completed this section, did they ask you any questions about the items?
Any concerns about providing this data for 6 years?
Excel mode (~15 minutes)
Probe for feedback about usability of the template
Prompt the participant to open the template that was sent by email ahead of time. Walk the participant through using the template.
If the participant used Excel mode for NPSAS:16, did they have any challenges with the template?
Did/would the participant key data or copy/paste from their own reports/systems?
How easy or difficult is it to identify which data elements should be provided for more than one academic year?
How easy or difficult is it to move from one academic year to another?
How easy or difficult is it to see that data is not required for a specific year?
Would you change anything else about the template?
CSV Mode (~5 minutes)
Discuss CSV capabilities at institutions
Is the participant familiar with CSV data?
(Describe CSV specs and file upload process, if needed.)
How likely is it that the institution could provide data in CSV format? Are they more likely to switch to CSV mode when more data elements are requested?
Probe for any final questions/concerns/comments.
Final Comments and Wrap-up (~5 minutes)
Prompt for any comments about NPSAS:16 experience that have not been covered previously.
Did you need to contact the Help Desk? If so, why did you need to contact the Help Desk? Were the Help Desk staff able to resolve your question(s)?
Prompt for any final questions or comments about the BPS instrument.
THANK PARTICIPANT FOR PARTICPATION
11
| File Type | application/vnd.openxmlformats-officedocument.wordprocessingml.document |
| Author | Wilson, Ashley |
| File Modified | 0000-00-00 |
| File Created | 2021-01-21 |
© 2026 OMB.report | Privacy Policy