Part B NPSAS 2016 Full Scale Institutions
Part B NPSAS 2016 Full Scale Institutions.docx
2015-16 National Postsecondary Student Aid Study (NPSAS:16) Full Scale Institution Contacting And Enrollment List Collection
OMB: 1850-0666
2015-16 NATIONAL POSTSECONDARY STUDENT AID STUDY (NPSAS:16)
Full
Scale Institution Contacting
and Enrollment List Collection
Supporting
Statement Part B & C
(OMB # 1850-0666 v. 15)
Submitted by
National Center for Education Statistics
U.S. Department of Education
Contents
B. Collection of Information Employing Statistical Methods 1
1. Respondent Universe 1
a. Institution Universe 1
b. Student Universe 1
2. Statistical Methodology 2
a. Institution Sample 2
b. Student Sample 4
c. Student Stratification 6
d. Study Members, Sample Sizes, and Student Sampling 8
e. Quality Control Checks for Lists and Sampling 9
3. Methods for Maximizing Response Rates 11
4. Tests of Procedures or Methods 12
5. Reviewing Statisticians and Individuals Responsible for Designing and Conducting the Study 12
C. Additional Enrollment List Items Justification 13
References 14
Tables Page
1. NPSAS:16 estimated institution sample sizes and yield 4
2. Weighted false positive rate observed in baccalaureate idntification, by sector: NPSAS:08 6
3. NPSAS:16 preliminary student sample sizes and yields 10
Figures Page
1. Flow chart of institutional contacting activities 11
This submission requests clearance for the 2015-16 National Postsecondary Student Aid Study (NPSAS:16) institution contacting, enrollment list collection, and list sampling activities. Materials for student contacting, and the student record abstraction and student survey will be submitted in a separate package, to be delivered in the fall of 2015.
The target population for NPSAS:16 includes nearly all Title IV participating postsecondary institutions in the 50 states, the District of Columbia, and Puerto Rico.1 To be eligible for NPSAS:16, an institution will be required, during the 2015–16 academic year, to
Offer an educational program designed for persons who had completed secondary education;
Offer at least one academic, occupational, or vocational program of study lasting at least 3 months or 300 clock hours;
Offer courses that were open to more than the employees or members of the company or group (e.g., union) that administered the institution;
Be located in the 50 states, the District of Columbia, or Puerto Rico;
Be other than a U.S. service academy; and
Have a signed Title IV participation agreement with the U.S. Department of Education.
Institutions providing only avocational, recreational, or remedial courses or only in-house courses for their own employees will be excluded.
NPSAS-eligible undergraduate and graduate students are those who were enrolled in the NPSAS institution in any term or course of instruction between July 1, 2015, and April 30, 2016, who were:
Enrolled in either (1) an academic program; (2) at least one course for credit that could be applied toward fulfilling the requirements for an academic degree; (3) exclusively noncredit remedial coursework but who the institution has determined were eligible for Title IV aid; or (4) an occupational or vocational program that requires at least 3 months or 300 clock hours of instruction to receive a degree, certificate, or other formal award; (5) not concurrently enrolled in high school; and (6) not enrolled solely in a General Educational Development (GED) or other high school completion program.
The NPSAS target population includes students enrolled in the academic year covering July 1 through June 30. Since NPSAS:2000, the enrollment lists contained students enrolled through April 30, excluding students first enrolled in May or June. This allows lists to be collected earlier and data collection to end earlier. The assumption is that only a small percentage of students are missed, and weighting can account for this minimal lack of coverage. NPSAS:96 data show that about three percent of the target population was missed. In the field test for NPSAS:16, we are currently requesting that some institutions send in lists later and include students enrolled through the end of June, with an indicator of students enrolled for the first time in May or June at that institution. We will not select student samples from these later lists, but will subsequently use administrative data and frame data from the lists to conduct a bias analysis to determine if there are differences between May/June enrollees and all other students. This analysis should confirm that obtaining lists of students enrolled through April 30 is sufficient, but if not, we will determine what changes to make for future collections.
The NPSAS:16 full-scale institution sampling frame will be selected in a different manner than has been done in the three previous NPSAS studies. The field test institution frame was constructed from the IPEDS:201213 header, Institutional Characteristics (IC), Completions, and Full-year Enrollment files. The full-scale institution frame will be constructed from the IPEDS:2013–14 header, Institutional Characteristics (IC), Completions, and Full-year Enrollment files. 2 Creating a separate institution frame for the field test and full-scale studies carries the advantage of having a more accurate and current full-scale institution sample because the frame will be constructed using the most up-to-date IPEDS files. Also, freshening the institution sample will not be needed because we will be using the most up-to-date institution frame available. We removed large systems (reporters) and institutions expected to be selected with certainty (i.e., probability of selection equal to one) in the full-scale frame from the field test frame, so as to not burden these systems and institutions with both field-test and full-scale data collections.3 Also, we will remove field-test sample institutions from the full-scale frame and later adjust the weights for the full-scale sample institutions so that they represent the full population of eligible institutions.
A number of for-profit institutions and large chains of for-profit institutions have been closed or sold recently, so we will take this into account in the sample design. We will use all available resources to identify these closed for-profit institutions. When using IPEDS to create the sampling frame, we will identify and exclude institutions that are still in IPEDS but that we know are no longer eligible for NPSAS due to closure.
For the small number of institutions with missing enrollment information, we will impute the data using the latest IPEDS imputation procedures to ensure complete data for the frame. Then a statistical sample of 2,000 institutions will be selected from the frame using stratified random sampling with probabilities proportional to a composite measure of size.4 This is the same methodology that we have used since NPSAS:96. Institution measures of size will be determined using full-year enrollment and baccalaureate completions data. Using a composite measure of size will ensure that the target sample sizes are achieved within institution and student sampling strata, while also achieving approximately equal student weights across institutions.
We will add a stratum for institution sampling by splitting the public 4-year non-doctorate-granting institutions into two sectors: public 4-year institutions that are primarily sub-baccalaureate and those that are primarily baccalaureate. The sub-baccalaureate institutions are mainly community colleges that offer a small number of bachelor’s degrees in select fields (CCBAs). Over 40 percent of students in public 4-year non-doctorate-granting institutions are in primarily sub-baccalaureate institutions. The students and funding for the CCBAs are more similar to 2-year than to other 4-year institutions.
Splitting the public 4-year non-doctorate-granting institutions into two sectors rather than sampling them together and providing an indicator on the data files allows us to oversample and control the sample size of the CCBAs and students in them, including the baccalaureate recipients. While using the IPEDS variable, INSTCAT,5 to identify CCBAs is helpful, we will work with the Community College Baccalaureate Association to fully identify these institutions and create a CCBA indicator. We will compare INSTCAT with the CCBA indicator, examine the differences, and determine how best to use INSTCAT and the CCBA indicator to accurately identify the public 4-year institutions that are primarily sub-baccalaureate.
The institutional strata will be the ten sectors that were used for NPSAS:12, with the public 4-year non-doctorate-granting institutions split into two sectors, as described above:6
Public less-than-2-year
Public 2-year
3a. Public 4-year non-doctorate-granting primarily sub-baccalaureate
3b. Public 4-year non-doctorate-granting primarily baccalaureate
4. Public 4-year doctorate-granting
5. Private nonprofit less-than-4-year
6. Private nonprofit 4-year non-doctorate-granting
7. Private nonprofit 4-year doctorate-granting
8. Private for-profit less-than-2-year
9. Private for-profit 2-year
10. Private for-profit 4-year
We expect to obtain an overall 99 percent eligibility rate and at least an overall 85 percent institutional participation (response) rate. The eligibility and response rates will likely vary by institutional strata. Based on these expected rates, the estimated institution sample sizes and sample yield by the ten institutional strata (described above) are presented in table 1.
Within each institutional stratum, additional implicit stratification will be accomplished by sorting the sampling frame by the following classifications:
Historically black colleges and universities (HBCU) indicator;
Hispanic-serving institutions (HSI) indicator7;
INSTCAT (institutional category derived using the level of offerings reported on the IPEDS Institutional Characteristics [IC] component and the number and level of awards that were reported on the IPEDS Completions [C] component);
Carnegie classifications of postsecondary institutions8;
The Office of Business Economics (OBE) region from the IPEDS header file (Bureau of Economic Analysis of the U.S. Department of Commerce Region9);
State, and system for states with large systems, e.g., the SUNY and CUNY systems in New York, the state and technical colleges in Georgia, and the California State University and University of California systems in California; and
The institution measure of size.
The objective of this implicit stratification will be to approximate proportional representation of institutions on these measures.
Table 1. NPSAS:16 estimated institution sample sizes and yield
Institutional sector |
Frame count1 |
Number sampled |
Number eligible |
List respondents |
Total |
7,192 |
2,000 |
1,980 |
1,683 |
Public less-than-2‑year |
258 |
22 |
22 |
19 |
Public 2‑year |
1,029 |
376 |
375 |
332 |
Public 4‑year non-doctorate-granting primarily sub-baccalaureate |
105 |
70 |
70 |
63 |
Public 4‑year non-doctorate-granting primarily baccalaureate |
241 |
107 |
106 |
96 |
Public 4‑year doctorate-granting |
341 |
341 |
340 |
298 |
Private nonprofit less-than-4‑year |
237 |
20 |
19 |
15 |
Private nonprofit 4‑year non-doctorate-granting |
983 |
325 |
325 |
277 |
Private nonprofit 4‑year doctorate-granting |
618 |
268 |
266 |
222 |
Private for-profit less-than-2‑year |
1,602 |
70 |
67 |
49 |
Private for-profit 2‑year |
1,024 |
120 |
117 |
93 |
Private for-profit 4‑year |
754 |
280 |
273 |
218 |
NOTE: Detail may not sum to totals because of rounding.
1 Institution counts based on IPEDS:2012–13 header files.
Although this submission is not for student data collection, the sample design is included here because part of the design is relevant for list collection, and the sampling of students from the enrollment lists will likely have to begin prior to OMB approval of the student data collection.
In previous rounds of NPSAS, sample institutions were asked to provide a list of all their NPSAS-eligible undergraduate and graduate students. While the student eligibility rate determined in the interview has typically been around 95 percent, there are some institutions that are confused by the eligibility criteria and provide incorrect lists. Some of these errors are detected during our list quality control (QC) process (see below), and we work with institutions to get correct information. This ineligibility can filter to the longitudinal studies for NPSAS nonrespondents. To evaluate a different approach, beginning in June 2015, we will conduct focus groups to learn whether institutions can provide the data needed on the enrollment lists that would enable NPSAS staff to determine which students are eligible for the study (OMB# 1850-0803). Depending on the outcome of the focus groups, we will utilize one of the following two approaches to determining student eligibility for the study.
Under Option A, NPSAS staff will request from study institutions enrollment lists for all students enrolled during the NPSAS study period. For each student, additional data elements (listed below) will be collected to help NPSAS staff determine students’ study eligibility prior to sampling. Alternatively, under Option B, the protocol for the full-scale data collection would remain the same as was used in the field test, where the list preparation instructions require institution staff to determine students’ study eligibility before adding them to the enrollment list, and exclude ineligible students from the list before submitting it. The determination as to which option will be used in the full-scale data collection will be made in fall 2015. It will be submitted for OMB’s review in a change memo by November 2015.
Under Option A, the new items that will be added to enrollment lists to determine eligibility will include the following yes/no indicators:
Enrolled in an academic program
Taking at least one course for credit that could be applied toward fulfilling the requirements for an academic degree
Taking noncredit remedial coursework but eligible for Title IV aid
Enrolled in an occupational or vocational program that required at least 3 months or 300 clock hours of instruction to receive a degree, certificate, or other formal award
Paid tuition to the NPSAS institution
Paid tuition solely to another institution (not the NPSAS institution)
Withdrew and received a full tuition refund
High school/completion program enrollment (see below)
Regardless of which option is implemented, the following data items will be requested for each student included in a sample institution’s enrollment list:
Full name
Social Security number (SSN)
Student ID number (if different from SSN)
Student level (undergraduate, master’s, doctoral-research/scholarship/other, doctoral-professional practice, other graduate)
Undergraduate degree program
Date of birth
Class level of undergraduates
High school/completion program completion date
Baccalaureate recipient indicator (for students who have already received their bachelor’s degree at the NPSAS institution since July 1, 2015)
Potential baccalaureate recipient indicator (for students who are expected to receive their bachelor’s degree at the NPSAS institution by June 30, 2016)10
Major or Classification of Instructional Programs (CIP) code (including both majors for students with double majors)
Contact information
Additionally, the following data items were requested in the field test for the first time, and will be requested during the full-scale:
Enrollment in high school (or completion program)
Date of first enrollment (at the postsecondary level)
Grade point average (GPA)
Number of credits accumulated
Account status (past due fee payment etc., that would prevent bachelor’s degree award)
Race/ethnicity11
Gender
Veteran status
First-time graduate student at the NPSAS institution (yes/no)
In addition to high school/completion program completion date, information on whether or not the student was enrolled in high school or a completion program, and the date of first enrollment at the postsecondary level, will help us identify ineligible students. GPA, number of credits accumulated, and account status may help identify baccalaureate recipients, as described below. Race and gender were used in the field test to check for bias when not including students on the enrollment lists who were enrolled in May and June, as described above. For the full-scale study, race, ethnicity, and gender will be used in the student- and item-level nonresponse bias analyses. Veteran status can only be collected if veterans self-identify or were known to be receiving veteran’s benefits, but NCES continues to investigate the option of working with Veterans Affairs to identify veteran students. The first-time graduate student indicator will be used for student stratification in section c, Student Stratification, below.
Identifying the Baccalaureate and Beyond Longitudinal Cohort
We will ask all institutions that award baccalaureate degrees to identify baccalaureate recipients. Instead of waiting until June for institutions to positively identify these students and send in lists, we will request that the enrollment lists for 4-year institutions include indicators of students who have received or will potentially receive a baccalaureate degree during the NPSAS year (yes, no, don’t know).
In the field test, we tried to determine whether the majority of the 4-year institutions are able to provide GPA, number of credits accumulated, and account overdue indicator for their students. We will create a model for use in full-scale sampling to further test the utility of these variables for identifying students to be sampled as potential baccalaureate recipients.
The percentage of students identified on the lists as being potential baccalaureate recipients who do not actually receive their bachelor’s degree in the NPSAS year (i.e., the false positive rate) is expected to be high, as shown in table 2. Therefore, the NPSAS sampling rates for students identified as potential baccalaureates and other undergraduate students will be adjusted to yield the appropriate sample sizes after accounting for the expected false positive and false negative rates by sector.
Table 2. Weighted false positive rate observed in baccalaureate identification, by sector: NPSAS:08 |
|
Institutional sector |
False positive rate (weighted) |
Public 4‑year non-doctorate-granting |
34.7 |
Public 4‑year doctorate-granting |
27.2 |
Private nonprofit 4-year non-doctorate-granting |
22.3 |
Private nonprofit 4-year doctorate-granting |
20.7 |
Private for-profit 4‑year |
32.9 |
The student sampling strata will be:
Baccalaureate recipients who are veterans
Baccalaureate recipients from science, technology, engineering, and mathematics (STEM) programs
Baccalaureate recipients from teacher education programs
Baccalaureate recipients from business programs
Baccalaureate recipients from Other programs
Other undergraduate students who are veterans
Other undergraduate students
Graduate students who are veterans
First-time graduate students
Master’s degree students in STEM programs
Master’s degree students in education and business programs
Master’s degree students in Other programs
Doctoral-research/scholarship/Other students in STEM programs
Doctoral-research/scholarship/Other students in education and business programs
Doctoral-research/scholarship/Other students in Other programs
Doctoral-professional practice students
Other graduate students.
If students fall into multiple strata, such as students who are veterans or students with double majors, the ordering of the strata above will be used to prioritize the stratification.
Several student subgroups will be intentionally sampled at rates different than their natural occurrence within the population due to specific analytic objectives. The following groups will be oversampled:
Baccalaureate recipients who are veterans
Baccalaureate recipients from STEM programs
Baccalaureate recipients from teacher education programs
Other undergraduate students who are veterans
Graduate students who are veterans
First-time graduate students
Master’s degree students in STEM programs
Doctoral-research/scholarship/other students in STEM programs
Undergraduate students and baccalaureate recipients in public 4-year non-doctorate-granting institutions that are primarily sub-baccalaureate
Undergraduate students at all award levels enrolled in for-profit institutions
Master’s degree students enrolled in for-profit institutions
Similarly, we anticipate the following groups will be undersampled:
Baccalaureate recipients from business programs
Master’s degree students in education and business programs
Doctoral-research/scholarship/other students in education and business programs
Because of their sheer number, sampling these last three groups in proportion to the population would make it difficult to draw inferences about the experiences of other baccalaureates, master’s degree, and doctoral students, respectively.
For baccalaureate recipients, we plan to add strata to disaggregate the baccalaureate recipients from STEM programs, as possible, such as for mathematics majors. As we create the NPSAS institution sampling frame in the summer of 2015, we will look at frame enrollment counts by major and determine necessary sample sizes, compute design effects, and see how much disaggregation the sample can handle. Also, for baccalaureate recipients from teacher education programs, we will identify these students using the CIP codes that specify these programs. We will also use Schools and Staffing Surveys (SASS) data to determine other majors that are likely to have a large number of students going into teaching at the secondary school level.
To identify and sample veterans, we will match the student enrollment lists received from institutions with a list of veterans provided by the U.S. Department of Veterans Affairs (VA). The logistics are still being worked out. Only veteran’s estimates at the baccalaureate, undergraduate, and graduate levels, and not by sector, are of interest. We will provide further details on the matching plan in a change request by November 2015.
We also considered oversampling students in professional science master’s programs, which is an emerging field and interesting for policy reasons. We think that some institutions will have difficulty accurately identifying these students, so we will not pursue this oversampling. However, it could be tested in the NPSAS:20 field test, if this trend continues. By oversampling master’s degree students enrolled in for-profit programs, we will capture many students in professional science master’s programs.
Substantial differences in federal loan rates were observed in NPSAS:12 between the full sample estimates and the poststratified estimates. This leads to increased weight variation but, more importantly, could lead to bias in the weighted estimates depending on the reason for the discrepancy in estimates. A possible source for error is in the ability of the sample design and sampling weights to account for financial aid application, receipt, or amounts. While we have identified some potential changes to the poststratification to help resolve this issue for NPSAS:16, we also plan to match the student lists to National Student Loan Data System (NSLDS) data and use the financial aid data for student implicit stratification. Within the student explicit strata, we will sort the students by federally aided/unaided, and this will allow the sample proportions of aided and unaided students to approximately match the population within institution and student strata.
Based on experience, we expect to obtain, at minimum, 95 percent eligibility rates and 70 percent student interview response rates, overall and in each sector. We also will continue to employ a variable-based (rather than source-based) definition of study member in the full-scale study, similar to that used in NPSAS:12 and NPSAS:08. Specifically, a study member will be defined as any sample member who is determined to be eligible for the study and, at minimum, has valid data from any source12 for the following:
Student type (undergraduate or graduate);
Date of birth or age;
Gender; and
At least 8 of the following 15 variables:
Dependency status
Marital status
Any dependents
Income
Expected family contribution (EFC)
Degree program
Class level
Baccalaureate status
Months enrolled
Tuition
Received federal aid
Received nonfederal aid
Student budget
Race
Parent education
We expect the rate of study membership to be about 90 percent.
Based on the expected interview response and eligibility rates, the preliminary student sample sizes and sample yield are presented in table 3. The table shows that NPSAS:16 will be designed to sample about 126,300 students. Table 3 does not show sample sizes adjusted for false positives and false negatives among those who are expected to complete requirements for the bachelor’s degree during the NPSAS year. The numbers in table 3 will be updated in fall 2015 after the optimal sample sizes to meet precision goals are determined, and the updated table will be provided in the change request by November 2015.
Students will be sampled on a flow basis as student lists are received. Stratified systematic sampling procedures will be utilized. Within the graduate student strata for veterans and first-time graduate students, the students will be sorted by master’s and doctoral to ensure that the sample will be roughly proportional to the frame. As mentioned above, all strata will be sorted (implicitly stratified) by federally aided/unaided students to maintain proportionality between the sample and frame. Sample yield will be monitored by institutional and student sampling strata, and the sampling rates will be adjusted early, if necessary, to achieve the desired sample yields.
The number of enrollees on each institution’s student list will be checked against the latest IPEDS full-year enrollment and completions data. The comparisons will be made for each student level: baccalaureate, undergraduate, and graduate. Based on experience with prior NPSAS collections and the current field test, only counts within 50 percent of nonimputed IPEDS counts will pass QC and will be moved on to student sampling.
Institutions that fail QC will be recontacted to resolve the discrepancy and to verify that the institution coordinator who prepared the student list clearly understood our request and provided a list of the appropriate students and data items. When we determine that the initial list provided by the institution was not satisfactory, we will request a replacement list. We will proceed with selecting sample students when we have confirmed either that the list received is correct or have received a corrected list.
Quality control is very important for sampling and all statistical activities. All statistical procedures will undergo thorough quality control checks. Technical operating procedures (TOPs) are in place for sampling and general programming that describe how to properly implement statistical procedures and QC checks. All statisticians will use a checklist to assure that all appropriate QC checks are done for student sampling. Some specific sampling QC checks will include, but are not limited to, checking that the:
Institutions and students on the sampling frames all have a known, non-zero probability of selection;
Distribution of implicit stratification for institutions is reasonable; and
Number of institutions and students selected matches the target sample sizes.
Table 3. NPSAS:16 preliminary student sample sizes and yields
Institutional sector |
Sample Students |
Eligible Students |
Responding Students |
Responding students per responding institution |
|||||||||
Total |
Baccalaureates |
Other undergraduate students |
Graduate students |
Total |
Baccalaureates |
Other undergraduate students |
Graduate students |
Total |
Baccalaureates |
Other undergraduate students |
Graduate students |
||
Total |
126,316 |
51,277 |
53,986 |
21,053 |
120,000 |
48,713 |
51,287 |
20,000 |
84,000 |
34,099 |
35,901 |
14,000 |
50 |
Public less-than-2-year |
680 |
0 |
680 |
0 |
608 |
0 |
608 |
0 |
382 |
0 |
382 |
0 |
20 |
Public 2-year |
21,296 |
0 |
21,296 |
0 |
19.617 |
0 |
19,617 |
0 |
13,321 |
0 |
13,321 |
0 |
40 |
Public 4‑year non-doctorate-granting primarily sub-baccalaureate |
6,445 |
3,570 |
1,875 |
999 |
6,171 |
3,396 |
1,824 |
950 |
4,583 |
2,470 |
1,429 |
684 |
73 |
Public 4‑year non-doctorate-granting primarily baccalaureate |
6,445 |
3,571 |
1,876 |
999 |
6,171 |
3,396 |
1,825 |
951 |
4,583 |
2,470 |
1,429 |
685 |
48 |
Public 4-year doctorate-granting |
26,120 |
13,224 |
6,346 |
6,550 |
24,806 |
12,487 |
6,129 |
6,189 |
18,892 |
9,358 |
4,945 |
4,589 |
63 |
Private nonprofit less-than-4-year |
870 |
0 |
870 |
0 |
838 |
0 |
838 |
0 |
543 |
0 |
543 |
0 |
37 |
Private nonprofit 4-year non-doctorate-granting |
12,160 |
6,813 |
2,601 |
2,746 |
11,540 |
6,434 |
2,512 |
2,595 |
8,682 |
4,772 |
2,006 |
1,904 |
31 |
Private nonprofit 4-year doctorate-granting |
13,890 |
7,590 |
2,271 |
4,029 |
13,262 |
7,219 |
2,209 |
3,834 |
9,920 |
5,347 |
1,762 |
2,811 |
45 |
Private for-profit less-than-2-year |
3,650 |
0 |
3,650 |
0 |
3,482 |
0 |
3,482 |
0 |
1,998 |
0 |
1,998 |
0 |
41 |
Private for-profit 2-year |
6,890 |
0 |
6,890 |
0 |
6,737 |
0 |
6,737 |
0 |
4,450 |
0 |
4,450 |
0 |
48 |
Private for-profit 4-year |
27,870 |
16,509 |
5,631 |
5,730 |
26,768 |
15,782 |
5,506 |
5,481 |
16,646 |
9,682 |
3,636 |
3,327 |
76 |
NOTE: Detail may not sum to totals because of rounding.
Establishing and maintaining contact with sampled institutions throughout the data collection process is vital to the success of NPSAS:16. Institutional participation is required in order to draw the student sample and collect institutional student records. The process in which institutions will be contacted is depicted in figure 1 and described below.
Figure 1. Flow chart of institutional contacting activities
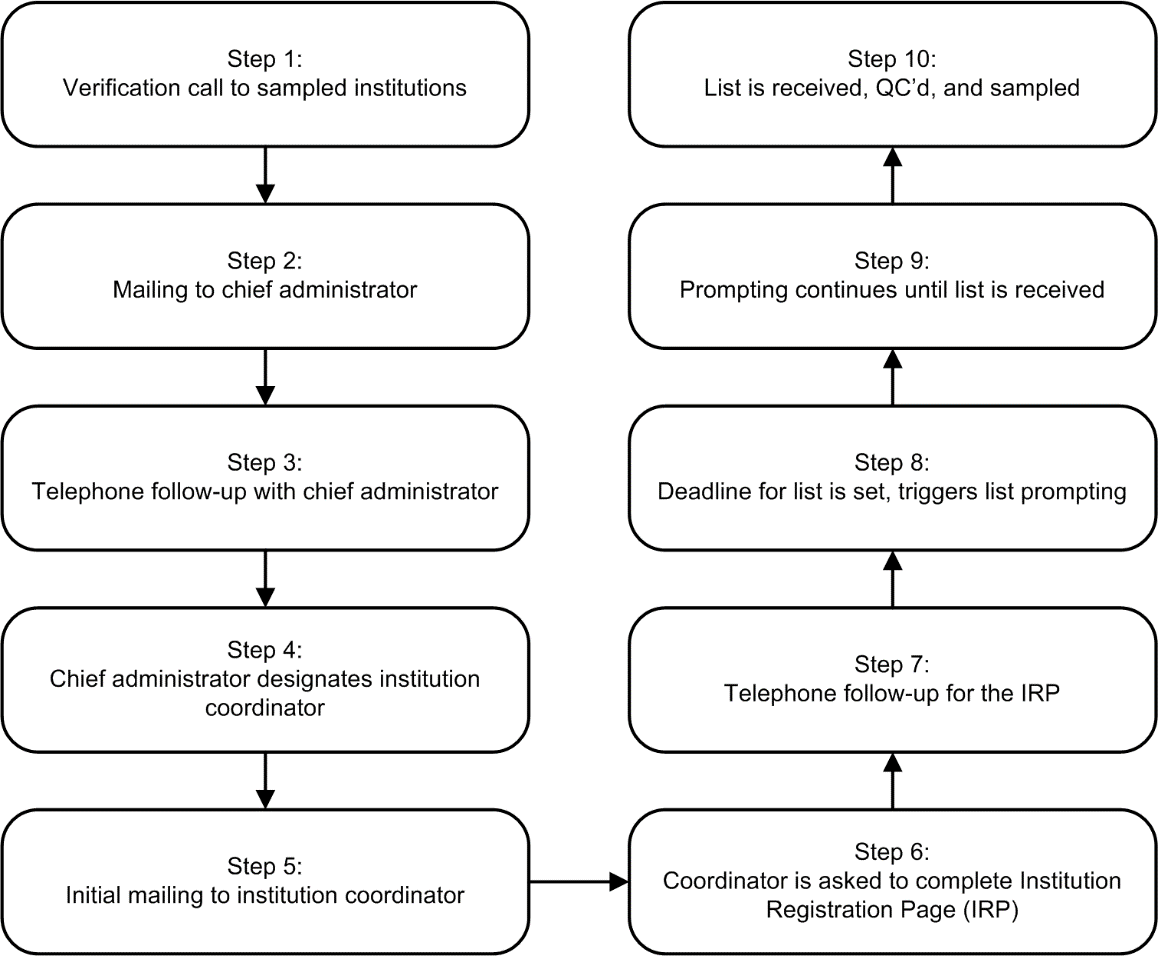
The contractor, RTI, will be responsible for contacting institutions on behalf of NCES. Each staff member will be assigned a set of institutions that is their responsibility throughout the data collection process. This allows the contractor's staff members to establish rapport with the institution staff and provides a reliable point of contact at the contractor’s call center. Staff members are thoroughly trained in basic financial aid concepts and in the purposes and requirements of the study, which helps them establish credibility with the institution staff.
Verification calls will be made to each sampled institution to confirm eligibility and confirm contact information obtained from the IPEDS header files prior to mailing study information. A sample of the script used for these calls can be found in appendix E. Once the contact information is verified, we will prepare and send an information packet to the chief administrator of each sampled institution. A copy of the letter and brochure can be found in appendix D. The materials will provide information about the purpose of the study and the nature of subsequent requests. A few days after the information packet is mailed, institutional contactors will conduct follow-up calls to secure study participation.
The choice of an appropriate coordinator at each institution will be left to the chief administrator, but institution contactors will work with the chief administrator’s office in attempting to designate the most appropriate coordinator. NCES and its contractor will identify relevant multi-campus systems within the sample as these systems can supply enrollment list data at the system level, minimizing burden on individual campuses. Even when it is not possible for a system to supply system-wide data, they can lend support in other ways, such as by prompting institutions under their jurisdiction to participate.
The institution coordinator will receive a mailing containing study materials and, as a first step, will be asked to complete the online Institution Registration Page (IRP), included in Appendix G. The primary function of the IRP is to confirm the date the institution will be able to provide the student enrollment list. Based on the information provided, a customized timeline will be created for each institution.
As a second step, institution coordinators will be asked to provide electronic enrollment lists of all students enrolled during the academic year. Depending on the information provided from the IRP, the earliest enrollment lists will be due in late January 2016. As described above, the lists will serve as the frame from which the student sample will be drawn. Email prompts will be sent to institution coordinators based on a customized schedule created for each institution. A reminder letter directing institution coordinators to the website for complete instructions will be sent, typically three weeks prior to the deadline.
As students are sampled from the enrollment lists, student records will be matched to the U.S. Department of Education Central Processing System (CPS)—which contains data on federal financial aid applications—for locating purposes and to reduce the burden on the institutions for the student record abstractions. The vast majority of the federal aid applicants (about 95 percent) will match successfully to the CPS prior to the student-level data collection. The merge with CPS will only occur for cases with an apparently valid SSN. A file will be sent to CPS and, in return, a large data file containing all students who applied for federal aid will be received. NPSAS staff have programs and procedures in place to prepare and submit files according to rigorous CPS standards, and to receive and process data obtained from CPS.
A file, which contains SSN and the first two letters of the sample member’s last name (but no other information), will be electronically uploaded on the FAFSA secure website for matching. Access to the FAFSA data site for the upload is restricted to authorized users, who are registered and provide identification/authentication information (ID and password). The file is retrieved by the CPS (the FAFSA contractor data system) for linkage. The linked file, containing student aid applications for matched records, is then made available to NPSAS staff only through a secure connection, which also requires username and password. Files will be downloaded directly into the contractor’s enhanced security network.
There will be no tests of procedures or methods as part of NPSAS:16 institution contacting, enrollment list collection, and list sampling.
The study is being conducted by the National Center for Education Statistics (NCES), U.S. Department of Education. NCES’s prime contractor is the RTI International (RTI). The following statisticians at NCES are responsible for the statistical aspects of the study: Dr. Tracy Hunt-White, Dr. Sean Simone, and Mr. Ted Socha. The RTI staff working on the statistical aspects of study design are: Dr. Jennifer Wine, Mr. Peter Siegel, Dr. Natasha Janson, Dr. Emilia Peytcheva, Mr. David Radwin, and Dr. Jennie Woo.
Subcontractors include Coffey Consulting; Hermes; HR Directions; Kforce Government Solutions, Inc.; Research Support Services; Shugoll Research; and Strategic Communications, Inc. Consultants are Dr. Sandy Baum, Ms. Alisa Cunningham, and Dr. Stephen Porter. Principal professional RTI staff, not listed above, who are assigned to the study include Mr. Jeff Franklin, Ms. Christine Rasmussen, Ms. Kristin Dudley, Mr. Brian Kuhr, and Ms. Tiffany Mattox.
To evaluate a different approach, beginning in June 2015, NCES will conduct focus groups to learn whether institutions can provide the data needed on the enrollment lists that would enable NPSAS staff to determine which students are eligible for the study (OMB# 1850-0803). Depending on the outcome of the focus groups, NCES will utilize one of the following two approaches to determining student eligibility for the study (see Part B, section 2.b).
Under Option A, NPSAS staff, rather than the institutions themselves, would determine their students’ study eligibility, saving institutions the burden of having to determine which students are eligible prior to submitting their enrollment lists to the NPSAS contractor. The institutions would be able to simply submit lists of all students enrolled at their institution for the NPSAS study period.
The yes/no data elements listed in the table below will be collected to support eligibility determination according to the criteria provided in Part B. Some of these criteria are already being assessed using items that were collected on the enrollment list in the field test.
Additional Yes/No Enrollment List Item |
Justification NPSAS study eligibility criteria for students on institutional enrollment lists |
Enrolled in an academic program |
Students must be enrolled in at least one term or course of instruction that could be applied toward fulfilling the requirements for an academic degree, or in an occupational or vocational program that requires at least 3 months or 300 clock hours of instruction to receive a degree, certificate, or other formal award. |
Taking at least one course for credit that could be applied toward fulfilling the requirements for an academic degree or enrolled in an occupational program |
|
Enrolled in an occupational or vocational program that required at least 3 months or 300 clock hours of instruction to receive a degree, certificate, or other formal award |
|
Taking noncredit remedial coursework that is eligible for Title IV aid |
Students who are enrolled solely in a remedial program are not eligible. |
Paid tuition to the NPSAS institution |
Student who paid tuition solely to a different institution are not eligible. |
Paid tuition solely to another institution (not the NPSAS institution) |
|
Withdrew and received a full tuition refund |
Students who withdrew from the NPSAS institution and received a full refund of their tuition are not eligible. |
References
Chromy, J.R. (1979). Sequential Sample Selection Methods. Proceedings of the Section on Survey Research Methods of the American Statistical Association, 401-406.
Cominole, M., Riccobono, J., Siegel, P., and Caves, L. (2009). 2007–08 National Postsecondary Student Aid Study (NPSAS:08) Full-scale Methodology Report (2010-188) (Forthcoming). National Center for Education Statistics, Institute of Education Sciences, U.S. Department of Education. Washington, DC.
Cominole, M., Siegel, P., Dudley, K., Roe, D., and Gilligan, T. 2004 National Postsecondary Student Aid Study (NPSAS:04) Full Scale Methodology Report (NCES 2006–180). U.S. Department of Education. Washington, DC: National Center for Education Statistics.
Cominole, M., Wheeless, S., Dudley, K., Franklin, J., and Wine, J. (2007). 2004/06 Beginning Postsecondary Students Longitudinal Study (BPS:04/06) Methodology Report (NCES 2008-184). National Center for Education Statistics, Institute of Education Sciences, U.S. Department of Education. Washington, DC.
Education Sciences Reform Act of 2002, 20 U.S.C. § 9573. (2007).
Folsom, R.E., Potter, F.J., and Williams, S.R. (1987). Notes on a Composite Size Measure for Self-Weighting Samples in Multiple Domains. Proceedings of the Section on Survey Research Methods of the American Statistical Association, 792-796.
Malizio, Andrew G. (1995) Methodology Report for the 1993 National Postsecondary Student Aid Study (NCES 95-211). U.S. Department of Education. Washington, DC: National Center for Education Statistics.
Riccobono, J., Cominole, M., Siegel, P., Gabel, T., Link, M., and Berkner, L. (2005). National Postsecondary Student Aid Study, 1999-2000 (NPSAS:2000) Methodology Report (NCES 2002–152). U.S. Department of Education. Washington, DC: National Center for Education Statistics.
Riccobono, J., Whitmore, R., Gabel, T., Traccarella, M., and Pratt, D.(1997). National Postsecondary Student Aid Study, 1995-96 (NPSAS:96), Methodology Report. (NCES 98-073). U.S. Department of Education. Washington, DC: National Center for Education Statistics.
Shepherd, Jane. (1992). Methodology Report for the 1990 National Postsecondary Student Aid Study (NCES 92-080). U.S. Department of Education. Washington, DC: National Center for Education Statistics.
1 Title IV participating institutions excluded from the target population are the U.S. service academies. These academies are not eligible for this financial aid study because of their unique funding/tuition base. Institutions in Puerto Rico were excluded from NPSAS:12 but will be included in NPSAS:16.
2 A preliminary sampling frame has been created using IPEDS:2012–13 data, and frame counts in table 1 are based on this preliminary frame. The frame will be recreated with IPEDS:2013–14 data prior to sample selection.
3 There will be a small chance of institutions being selected for both the field test and full-scale studies, such as small systems.
4 Folsom, R.E., Potter, F.J., and Williams, S.R. (1987). Notes on a Composite Size Measure for Self-Weighting Samples in Multiple Domains. In Proceedings of the Section on Survey Research Methods of the American Statistical Association. Alexandria, VA: American Statistical Association, 792-796.
5 INSTCAT is an institutional category derived using the level of offerings reported on the IPEDS Institutional Characteristics (IC) component and the number and level of awards that were reported on the IPEDS Completions (C) component.
6 The sector numbering will need to be determined for the data files.
7 A Hispanic-serving institutions indicator is no longer available from IPEDS, so we will create an indicator following the logic that was previously used for IPEDS.
8 We will decide what, if any, collapsing is needed of the categories for the purposes of implicit stratification.
9 For sorting purposes, Alaska and Hawaii will be combined with Puerto Rico in the Outlying Areas region rather than in the Far West region.
10 Splitting the baccalaureate recipients into two items is based on the field test. It will make providing baccalaureate information easier for institutions that cannot identify the potential baccalaureate recipients and will help with QC checks against IPEDS counts for institutions that cannot identify the potential baccalaureate recipients.
11 We did not request ethnicity on the field test enrollment lists but, in working with institutions and wanting the definition of race/ethnicity on the lists to match the definition in student records, we are adding ethnicity to the enrollment list data items.
12 Sample members also must have valid data for at least one of the eighteen specified variables from at least one data source other than the Current Population Survey (CPS).
| File Type | application/vnd.openxmlformats-officedocument.wordprocessingml.document |
| File Title | Chapter 2 |
| Author | spowell |
| File Modified | 0000-00-00 |
| File Created | 2021-01-25 |
© 2026 OMB.report | Privacy Policy