Carried Over (Approved) Part B
Carried Over (Approved) Part B NPSAS 2016 Field Test Institutions - revised 2014-12.docx
2015-16 National Postsecondary Student Aid Study (NPSAS:16) Field Test Student Data Collection
Carried Over (Approved) Part B
OMB: 1850-0666
2015-16 NATIONAL POSTSECONDARY STUDENT AID STUDY (NPSAS:16)
Field
Test Institution Contacting
and Enrollment List Collection
Supporting
Statement Part B & C
(OMB # 1850-0666 v.12)
Submitted by
National Center for Education Statistics
U.S. Department of Education
Contents
B. Collection of Information Employing Statistical Methods 1
1. Respondent Universe 1
a. Institution Universe 1
b. Student Universe 1
2. Statistical Methodology 1
a. Institution Sample 1
b. Student Sample 3
3. Institutional Contacting 9
4. Tests of Procedures or Methods 10
5. Reviewing Statisticians and Individuals Responsible for Designing and Conducting the Study 10
6. Other Contractors’ Staff Responsible for Conducting the Study 11
C. Information Collected on Enrollment Lists 13
D. References 15
Tables Page
7. NPSAS:16 field test estimated institution sample sizes and yield 3
8. NPSAS:16 preliminary full-scale institution sample sizes and yield 3
9. Weighted false positive rate observed in baccalaureate identification, by sector: NPSAS:08 5
10. Expected student sample sizes and yields for the NPSAS:16 field test 7
11. Preliminary student sample sizes and yields, NPSAS:16 full-scale 8
Figures Page
1. Flow chart of institutional contacting activities 9
This submission requests clearance for the 2015-16 National Postsecondary Student Aid Study (NPSAS:16) field test institution contacting, enrollment list collection, and list sampling activities. Materials for student contacting, and the student record abstraction and student survey will be submitted in a separate package, to be delivered in the fall of 2014. Specific plans are provided below.
To be eligible for NPSAS:16, an institution will be required, during the 2014–15 academic year for the field test and the 2015-16 academic year for the full-scale, to:
Offer an educational program designed for persons who had completed secondary education;
Offer at least one academic, occupational, or vocational program of study lasting at least 3 months or 300 clock hours;
Offer courses that are open to more than the employees or members of the company or group (e.g., union) that administered the institution;
Be located in the 50 states, the District of Columbia, or Puerto Rico;1
Be other than a U.S. Service Academy; and
Have a signed Title IV participation agreement with the U.S. Department of Education.
Institutions providing only avocational, recreational, or remedial courses or only in-house courses for their own employees will be excluded. The five U.S. Service Academies are excluded because of their unique funding/tuition base.
The students eligible for inclusion in the NPSAS:16 sample are those who are enrolled in a NPSAS-eligible institution in any term or course of instruction between July 1, 2014 and April 30, 2015 for the field test and between July 1, 2015 and April 30, 2016 for the full-scale who are:
Enrolled in (a) an academic program; (b) at least one course for credit that could be applied toward fulfilling the requirements for an academic degree; (c) exclusively non-credit remedial coursework but who the institution has determined are eligible for Title IV aid; or (d) an occupational or vocational program that required at least 3 months or 300 clock hours of instruction to receive a degree, certificate, or other formal award;
Not currently enrolled in high school; and
Not enrolled solely in a GED or other high school completion program.
The NPSAS:16 field test and full-scale institution samples will be selected in a different manner than has been done in the three previous NPSAS studies. The field test institution frame will be constructed from the IPEDS:201213 header, Institutional Characteristics (IC), Completions, and Full-year Enrollment files.2 The full-scale institution frame will be constructed a year later from the IPEDS:2013-14 header, Institutional Characteristics (IC), Completions, and Full-year Enrollment files. Creating a separate institution frame for the field test and full-scale studies carries the advantage of having a more accurate and current full-scale institution sample since the frame will be constructed using the most up-to-date IPEDS files. Also, freshening the institution sample will not be needed since we will be using the most up-to-date institution frame available. So that we do not burden them with both field test and full-scale data collections, we will remove from the field test frame any large systems (reporters) and individual institutions likely to be selected with certainty (i.e., probability of selection equal to one) for the full-scale.3 Also, we will remove field test sample institutions from the full-scale frame and later adjust the weights for the full-scale sample institutions so that they represent the full population of eligible institutions.
For the small number of institutions on the frames that have missing enrollment information, we will impute the data using the latest IPEDS imputation procedures to guarantee complete data for the frames. Then, a statistical sample of 600 institutions will be selected from the field test frame and about 2,000 institutions will be selected from the full-scale frame. We will select institutions for both the field test and full-scale studies using stratified random sampling with probabilities proportional to a composite measure of size,4 which is the same methodology that we have used since NPSAS:96. Institution measures of size will be determined using full-year enrollment and baccalaureate completions data. Using composite measure of size sampling will ensure that the full-scale target sample sizes are achieved within institution and student sampling strata while also achieving approximately equal student weights across institutions. We will purposively subsample 300 of the 600 field test institutions to allow for some flexibility in the sample, such as excluding institutions unlikely to participate based on past experience.
The institutional strata will be the ten sectors that were used for NPSAS:12, which are based on institutional level, control, and highest level of offering:
Public Less-Than-2-Year
Public 2-year
Public 4-year non-doctorate-granting
Public 4-year doctorate-granting
Private for-profit less-than-2-year
Private for-profit 2-year
Private for-profit 4-year
Private nonprofit less-than-4-year
Private Nonprofit 4-Year Non-Doctorate-Granting
Private nonprofit 4-year doctorate-granting
Further refinement of the ten sectors may be deemed necessary for the full-scale in order to target specific types of institutions that are not being captured sufficiently with the current ten sectors or to adapt to the changing landscape in postsecondary education. For example, the private for-profit 4-year sector could possibly be split into two strata based on academic offerings.
For the field test and full-scale, we expect to obtain overall 97 and 99 percent eligibility rates, respectively, and at least an overall 85 percent institutional participation (response) rate. The eligibility and response rates will likely vary by institutional strata. Based on these expected rates, the estimated institution sample sizes and sample yield by the ten institutional strata (described above) for the field test and full-scale are presented in tables 7 and 8, respectively.
Within each institutional stratum, additional implicit stratification will be accomplished by sorting the sampling frame by the following classifications: (1) historically Black colleges and universities (HBCU) indicator; (2) Hispanic-serving institutions (HSI) indicator; 5 (3) Carnegie classifications of postsecondary institutions;6 (4) the Office of Business Economics (OBE) Region from the IPEDS header file (Bureau of Economic Analysis of the U.S. Department of Commerce Region);7 (5) state and, for states with large systems, e.g., the SUNY and CUNY systems in New York, the state and technical colleges in Georgia, and the California State University and University of California systems in California; and (6) the institution measure of size. The objective of this implicit stratification will be to approximate proportional representation of institutions on these measures.
Table 7. NPSAS:16 field test estimated institution sample sizes and yield
Institutional sector |
Frame count1 |
Number sampled |
Number eligible |
List respondents |
Total |
7,278 |
300 |
290 |
247 |
Public less-than-2‑year |
256 |
5 |
5 |
4 |
Public 2‑year |
1,046 |
11 |
11 |
9 |
Public 4‑year non-doctorate-granting |
348 |
110 |
106 |
95 |
Public 4‑year doctorate-granting |
338 |
0 |
0 |
0 |
Private nonprofit less-than-4‑year |
256 |
6 |
6 |
4 |
Private nonprofit 4‑year non-doctorate-granting |
973 |
125 |
122 |
102 |
Private nonprofit 4‑year doctorate-granting |
609 |
21 |
20 |
17 |
Private for-profit less-than-2‑year |
1,637 |
8 |
7 |
5 |
Private for-profit 2‑year |
1,030 |
5 |
5 |
4 |
Private for-profit 4‑year |
785 |
9 |
9 |
7 |
1Institution counts based on IPEDS:2011‑12 header files.
NOTE: Detail may not sum to totals because of rounding.
Table 8. NPSAS:16 preliminary full-scale institution sample sizes and yield
Institutional sector |
Frame count1 |
Number sampled |
Number eligible |
List respondents |
Total |
7,278 |
2,000 |
1,980 |
1,683 |
Public less-than-2‑year |
256 |
22 |
22 |
19 |
Public 2‑year |
1,046 |
376 |
375 |
332 |
Public 4‑year non-doctorate-granting |
348 |
180 |
179 |
162 |
Public 4‑year doctorate-granting |
338 |
338 |
337 |
295 |
Private nonprofit less-than-4‑year |
256 |
20 |
19 |
15 |
Private nonprofit 4‑year non-doctorate-granting |
973 |
325 |
325 |
277 |
Private nonprofit 4‑year doctorate-granting |
609 |
268 |
266 |
222 |
Private for-profit less-than-2‑year |
1,637 |
70 |
67 |
49 |
Private for-profit 2‑year |
1,030 |
120 |
117 |
93 |
Private for-profit 4‑year |
785 |
280 |
273 |
218 |
1Institution counts based on IPEDS:2011‑12 header files.
NOTE: Detail may not sum to totals because of rounding.
Although this submission is not for student data collection, the sample design for the field test is included here because part of the design is relevant for list collection, and the sampling of students from the enrollment lists will likely have to begin prior to OMB approval of the field test student data collection.
Student Enrollment List Collection
To begin NPSAS data collection, sampled institutions are asked to provide a list of all their NPSAS-eligible undergraduate and graduate students enrolled in the targeted academic year, covering July 1 through June 30. Since NPSAS:2000, institutions have been asked to limit listed students to only those enrolled through April 30. This truncated enrollment period excludes students who first enrolled in May or June, but it allows lists to be collected earlier and, in turn, data collection to be completed in less than 12 months. When evaluated during NPSAS:96, the abbreviated schedule missed only about three percent of the target population, and weighting can account for the minimal lack of coverage.
Given the short time frame for the NPSAS:16 field test, institutions with continuous enrollment will be asked to include students enrolled only through March 31, instead of April 30, to expedite data collection.8 In order to re-evaluate the impact of the truncated enrollment period, i.e., April 30 instead of June 30, we will request that the date first enrolled at the institution be included on the lists and that some field test institutions provide lists with students enrolled through the end of June. We will not select student samples from these later lists, but will use administrative data and frame data from the lists to conduct a bias analysis to determine if there are differences between May/June2 enrollees and all other students. If this analysis shows that there are differences, we will modify our approach prior to the full-scale list collection.
Similar to past NPSAS studies, the following data items will be requested for NPSAS-eligible students enrolled at each sample institution:
Full name
Social Security number
Student ID number (if different from SSN)
Student level (undergraduate, masters, doctoral-research/scholarship/other, doctoral-professional practice, other graduate)9
Undergraduate degree program9
Date of first enrollment
Date of birth
Class level of undergraduates
Potential baccalaureate recipient indicator
Major or CIP code
Contact information
Additionally, the following data items will be requested specifically during the field test to determine the completeness of the data institutions are able to provide:
Veteran status
GPA
Number of credits accumulated
Account status (past due, etc.)
Race/ethnicity
Gender
First-time graduate student indicator
High school graduation date
Student’s high school enrollment status
Institutions can only indicate veterans who self-identify or who are known to be receiving veteran’s benefits, but NCES will continue to investigate the option of working with Veterans Affairs (VA) to identify veteran students. GPA, number of credits accumulated, and account status may be used to help identify baccalaureate recipients, as described below. Race/ethnicity, gender, and date first enrolled at the institution will be used to check for bias when not including students on the enrollment lists enrolled in May and June, as described above. The first-time graduate student indicator will help us explore the feasibility of a possible future study of graduate student persistence.
Baccalaureate Identification
NPSAS:16 will serve as the base year data collection for the 2016/17 Baccalaureate and Beyond Longitudinal Study (B&B:16/17) and will be used to qualify students for cohort membership. To that end, we will ask institutions that award baccalaureate degrees to identify students who are expected to receive the baccalaureate degree by June 30 of the NPSAS year (2015 for the field test; 2016 for the full-scale). Instead of waiting until June for institutions to positively confirm degree award to these students, we will request that enrollment lists include an indicator (B&B flag) of cohort eligibility for students who have received or are expected to receive the baccalaureate degree during the NPSAS year. In addition, we will request an indicator of class level for undergraduates (first year, second year, third year, fourth year, or fifth year). Based on the NPSAS:08 experience, we estimate that about 64 percent of the fourth and fifth year students will be baccalaureate recipients during the NPSAS year, as will about 6 percent of the third year students.
If a majority of the 4-year institutions are able to provide GPA, number of credits accumulated, and account status, we will create a model to test the ability of these variables to predict actual baccalaureate receipt, based on interview responses. If these variables can be collected on lists and used to predict baccalaureate receipt, we can potentially use them in full-scale sampling to better identify students to be sampled as potential baccalaureate recipients.
As shown in table 9, the percentage of students, initially flagged as potential baccalaureate recipients, who do not actually receive their bachelor’s degree in the NPSAS year (i.e., the false positive rate) is expected to be high. Therefore, the NPSAS sampling rates for potential baccalaureates and other undergraduate students will be adjusted to yield the appropriate sample sizes, after accounting for the expected false positive and false negative rates by sector.
Table 9. Weighted false positive rate observed in baccalaureate identification, by sector: NPSAS:08
Institutional sector |
False positive rate (weighted) |
Public 4‑year non-doctorate-granting |
34.7 |
Public 4‑year doctorate-granting |
27.2 |
Private nonprofit 4-year non-doctorate-granting |
22.3 |
Private nonprofit 4-year doctorate-granting |
20.7 |
Private for-profit 4‑year |
32.9 |
Student Stratification
The student sampling strata for the field test will be:
Baccalaureate STEM majors
Baccalaureate business majors
Baccalaureate teacher majors
All other baccalaureate students
Other undergraduate students
Masters students
Doctoral STEM majors
Doctoral other majors
Other graduate students
Several student subgroups will be intentionally sampled at rates different than their natural occurrence within the population due to specific full-scale analytic objectives. We anticipate that the four following groups will be oversampled in the field test:
Baccalaureate STEM majors
Baccalaureate teacher majors
Doctoral STEM majors
Undergraduate students at all award levels enrolled in for-profit institutions
In addition, because of their sheer number, we anticipate that baccalaureate business majors will be under-sampled. Sampling business majors in proportion to the population would make it difficult to draw inferences about the experiences of baccalaureates more broadly.
In the field test, we will investigate the possibility of identifying federal financial aid applicants or recipients prior to student sampling. If this is feasible then, in the full-scale, we could stratify students by financial aid application status, Pell Grant or Direct Loan receipt, or Pell Grant or Direct Loan amount. This additional stratification for sampling may help the poststratification weighting adjustment, which is typically done using Pell Grant and Direct Loan control totals.10 To determine feasibility, NCES will talk with Federal Student Aid (FSA) about obtaining student data from CPS, Pell, and/or Direct loan files prior to sampling. Timing of when the relevant data are available from FSA may be an issue. We will explore how best to combine the financial aid strata with the other strata mentioned above, and we will look at design effects.
Sample Sizes and Student Sampling
Based on past experience, NCES expects to obtain, minimally, 95 percent eligibility rates and 70 percent student interview response rates overall and in each sector. The expected student sample sizes and sample yield are presented in table 10 for the field test. The field test will be designed to sample about 4,500 students, which is similar to NPSAS:12. Table 11 does not show sample sizes adjusted for false positives and false negatives, but a large percentage of the field test sample will be comprised of potential baccalaureates in order to obtain a sufficient sample yield for the B&B field tests. The NPSAS field test sample size of graduate students is small due to the large baccalaureate sample size.
To meet the truncated field test schedule, students must be selected by mid-May. Like past NPSAS field tests, the 3,000 student respondents to the NPSAS:16 field test will be sufficient to test the data collection instruments. However, in order to also reach a good representation of students across the ten sectors, the number of participating institutions needs to be at least 150. If more than 150 lists are received by mid-May, only 150 will be sampled. Limiting the sampling to 150 institutions will increase the sample size for each institution, making the Student Records burden closer to what it will be in the full-scale.
Students will be sampled on a flow basis as student lists are received. Stratified systematic sampling procedures will be utilized. Sample yield will be monitored by institutional and student sampling strata, and the sampling rates will be adjusted early, if necessary, to achieve the desired sample yields.
The student sampling procedures implemented in the field test will be as comparable as possible to those planned for the full-scale study, even though simpler procedures would suffice for the field test alone.
Quality Control Checks for Lists and Sampling
The number of enrollees on each institution’s student list will be checked against the latest IPEDS full-year enrollment and completions data. The comparisons will be made for each student level: baccalaureate, undergraduate, and graduate. Based on past experience, we recommend only counts within 50 percent of non-imputed IPEDS counts will pass QC and will be moved on to student sampling. We will re-evaluate these checks after the field test for use in the full-scale study.
Table 10. Expected student sample sizes and yields for the NPSAS:16 field test
Institutional sector |
Sample students |
Eligible students |
Responding students |
Responding students per responding institution1 |
|||||||||
Total |
Bacca-laureates |
Other under- graduate students |
Graduate students |
Total |
Bacca-laureates |
Other under-graduate students |
Graduate students |
Total |
Bacca-laureates |
Other under-graduate students |
Graduate students |
||
Total |
4,511 |
1,695 |
2,616 |
200 |
4,286 |
1,610 |
2,486 |
190 |
3,000 |
1,127 |
1,740 |
133 |
12 |
|
|
|
|
|
|
|
|
|
|
|
|
|
|
Public less-than-2-year |
123 |
0 |
123 |
0 |
109 |
0 |
109 |
0 |
67 |
0 |
67 |
0 |
16 |
Public 2-year |
445 |
0 |
445 |
0 |
407 |
0 |
407 |
0 |
270 |
0 |
270 |
0 |
29 |
Public 4-year non-doctorate-granting |
951 |
501 |
429 |
21 |
910 |
476 |
414 |
20 |
669 |
337 |
317 |
14 |
7 |
Public 4-year doctorate-granting |
0 |
0 |
0 |
0 |
0 |
0 |
0 |
0 |
0 |
0 |
0 |
0 |
0 |
Private nonprofit less-than-4-year |
149 |
0 |
149 |
0 |
142 |
0 |
142 |
0 |
90 |
0 |
90 |
0 |
21 |
Private nonprofit 4-year non-doctorate-granting |
969 |
506 |
432 |
31 |
921 |
478 |
414 |
29 |
692 |
345 |
323 |
21 |
7 |
Private nonprofit 4-year doctorate-granting |
948 |
442 |
379 |
127 |
907 |
421 |
366 |
121 |
693 |
304 |
285 |
86 |
42 |
Private for-profit less-than-2-year |
249 |
0 |
249 |
0 |
236 |
0 |
236 |
0 |
132 |
0 |
132 |
0 |
25 |
Private for-profit 2-year |
61 |
0 |
61 |
0 |
59 |
0 |
59 |
0 |
38 |
0 |
38 |
0 |
10 |
Private for-profit 4-year |
616 |
246 |
349 |
21 |
594 |
235 |
339 |
20 |
350 |
141 |
219 |
12 |
50 |
1The number of responding students per participating institution is based on the 247 list respondents shown above in table 7, rather than on the 150 institutions from which students will be selected.
NOTE: Detail may not sum to totals because of rounding.
Table 11. Preliminary student sample sizes and yields, NPSAS:16 full-scale
Institutional sector |
Sample students |
Eligible students |
Responding students |
Responding students per responding institution |
|||||||||
Total |
Bacca-laureates |
Other under-graduate students |
Graduate students |
Total |
Bacca-laureates |
Other under-graduate students |
Graduate students |
Total |
Bacca-laureates |
Other under-graduate students |
Graduate students |
||
Total |
126,316 |
51,277 |
53,986 |
21,053 |
120,000 |
48,713 |
51,287 |
20,000 |
84,000 |
34,099 |
35,901 |
14,000 |
50 |
|
|
|
|
|
|
|
|
|
|
|
|
|
|
Public less-than-2-year |
680 |
0 |
680 |
0 |
608 |
0 |
608 |
0 |
382 |
0 |
382 |
0 |
20 |
Public 2-year |
21,296 |
0 |
21,296 |
0 |
19,617 |
0 |
19,617 |
0 |
13,321 |
0 |
13,321 |
0 |
40 |
Public 4-year non-doctorate-granting |
12,890 |
7,141 |
3,751 |
1,998 |
12,342 |
6,792 |
3,649 |
1,901 |
9,166 |
4,940 |
2,858 |
1,369 |
57 |
Public 4-year doctorate-granting |
26,120 |
13,224 |
6,346 |
6,550 |
24,806 |
12,487 |
6,129 |
6,189 |
18,892 |
9,358 |
4,945 |
4,589 |
64 |
Private nonprofit less-than-4-year |
870 |
0 |
870 |
0 |
838 |
0 |
838 |
0 |
543 |
0 |
543 |
0 |
37 |
Private nonprofit 4-year non-doctorate-granting |
12,160 |
6,813 |
2,601 |
2,746 |
11,540 |
6,434 |
2,512 |
2,595 |
8,682 |
4,772 |
2,006 |
1,904 |
31 |
Private nonprofit 4-year doctorate-granting |
13,890 |
7,590 |
2,271 |
4,029 |
13,262 |
7,219 |
2,209 |
3,834 |
9,920 |
5,347 |
1,762 |
2,811 |
45 |
Private for-profit less-than-2-year |
3,650 |
0 |
3,650 |
0 |
3,482 |
0 |
3,482 |
0 |
1,998 |
0 |
1,998 |
0 |
41 |
Private for-profit 2-year |
6,890 |
0 |
6,890 |
0 |
6,737 |
0 |
6,737 |
0 |
4,450 |
0 |
4,450 |
0 |
48 |
Private for-profit 4-year |
27,870 |
16,509 |
5,631 |
5,730 |
26,768 |
15,782 |
5,506 |
5,481 |
16,646 |
9,682 |
3,636 |
3,327 |
76 |
NOTE: Detail may not sum to totals because of rounding.
Institutions that fail QC will be re-contacted to resolve the discrepancy and to verify that the institution coordinator who prepared the student list clearly understood our request and provided a list of the appropriate students. When we determine that the initial list provided by the institution was not satisfactory, we will request a replacement list. We will proceed with selecting sample students when we have either confirmed that the list received is correct or have received a corrected list.
Quality control (QC) is very important for sampling and all statistical activities, and statistical procedures will undergo thorough quality control checks. We have technical operating procedures (TOPs) in place for sampling and general programming. These TOPs describe how to properly implement statistical procedures and QC checks. We will employ a checklist for all statisticians to use to make sure that all appropriate QC checks are done for student sampling.
Some specific sampling QC checks will include, but are not limited to, checking that the:
Institutions and students on the sampling frames all have a known, non-zero probability of selection;
Distribution of implicit stratification for institutions is reasonable; and
Number of institutions and students selected match the target sample sizes.
Establishing and maintaining contact with sampled institutions throughout the data collection process is vital to the success of NPSAS:16. Institutional participation is required in order to draw the student sample and collect institutional student records. The process in which institutions will be contacted is depicted in figure 1 and described below.
Figure 1. Flow chart of institutional contacting activities
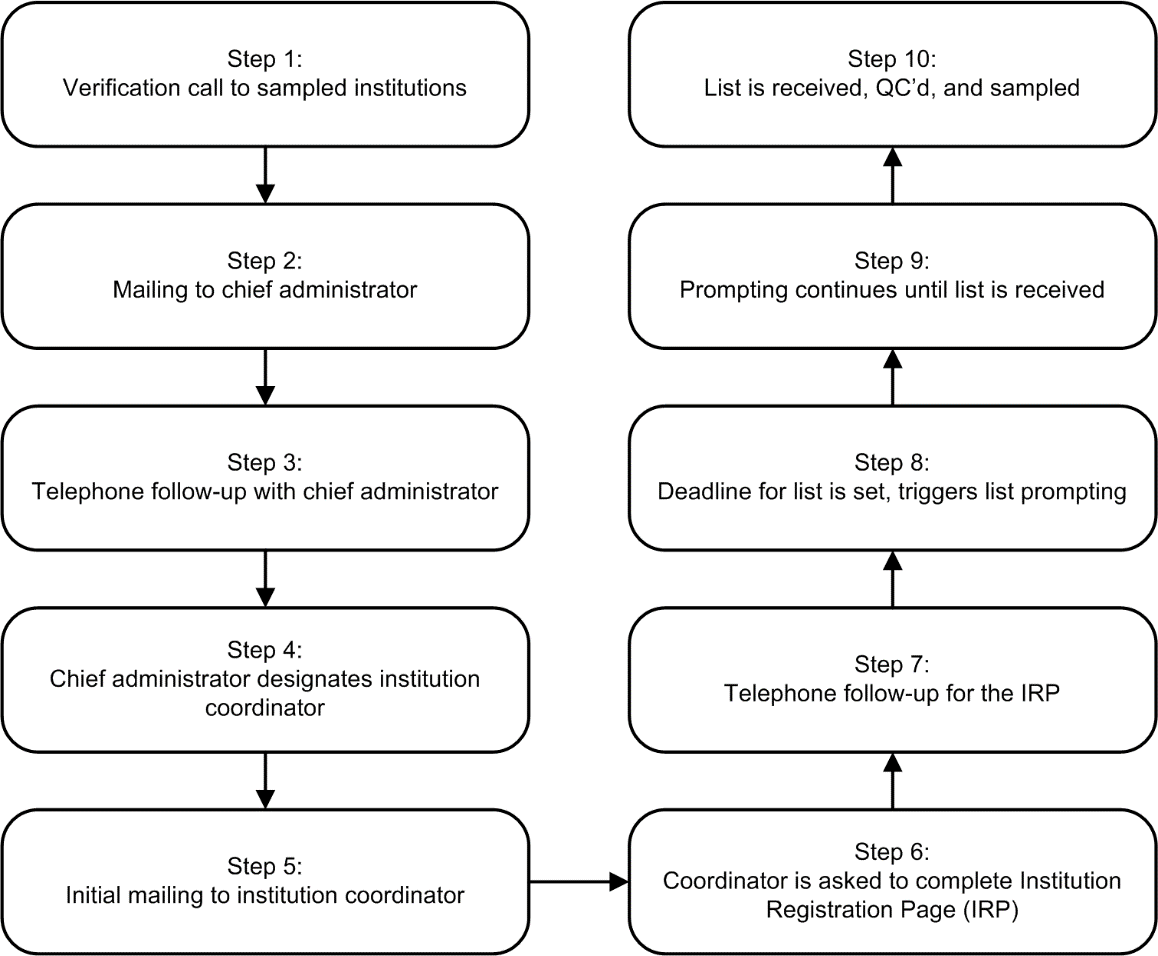
The contractor, RTI, will be responsible for contacting institutions on behalf of NCES. Each staff member will be assigned a set of institutions that is their responsibility throughout the data collection process. This allows the contractor's staff members to establish rapport with the institution staff and provides a reliable point of contact at the contractors call center. Staff members are thoroughly trained in basic financial aid concepts and in the purposes and requirements of the study, which helps them establish credibility with the institution staff.
Verification calls will be made to each sampled institution to confirm eligibility and verify contact information, obtained from the IPEDS header files, prior to mailing study information. A sample of the script used for these calls can be found in appendix D. Once the contact information is verified, we will prepare and send an information packet to the chief administrator of each sampled institution. A copy of the letter and brochure can be found in appendix E. The materials will provide information about the purpose of the study and the nature of subsequent requests. Approximately one week after the information packet is mailed; institutional contactors will conduct follow-up calls to secure study participation.
The choice of an appropriate coordinator at each institution will be left to the chief administrator, but institution contactors will work with the chief administrator’s office in attempting to designate the most appropriate coordinator. NCES and its contractor will identify relevant multicampus systems within the field test sample as these systems can supply enrollment list data at the system level, minimizing burden on individual campuses. Even when it is not possible for a system to supply system-wide data, they can lend support in other ways, such as by prompting institutions under their jurisdiction to participate.
The institutional coordinator will receive a mailing containing study materials and, as a first step, will be asked to complete the online Institutional Registration Page (IRP). A copy of the IRP is included in Appendix F. The primary function of the IRP is to confirm the date the institution will be able to provide the student enrollment list. Based on the information provided, a customized timeline will be created for each institution.
As a second step, institutional coordinators will be asked to provide electronic enrollment lists of all students enrolled during the academic year. Depending on the information provided from the IRP, the earliest enrollment lists will be due in late January. As described above, the lists will serve as the frame from which the student sample will be drawn. Email prompts will be sent to institutional coordinators based on a customized schedule created for each institution. A reminder letter directing institution coordinators to the website for complete instructions will be sent, typically three weeks prior to the deadline.
There will be no tests of procedures or methods as part of NPSAS:16 institution contacting, enrollment list collection, and list sampling.
The following statisticians at NCES are responsible for the statistical aspects of the study: Dr. Tracy Hunt-White, Dr. Sarah Crissey, Dr. Sean Simone, and Mr. Ted Socha. Names of RTI staff working on the statistical aspects of study design along with their affiliation and telephone numbers are provided below.
Name |
Affiliation |
Telephone Number |
Dr. Jennifer Wine |
RTI |
919-541-6870 |
Dr. James Chromy |
RTI |
919-541-7019 |
Mr. Peter Siegel |
RTI |
919-541-6348 |
Dr. Natasha Janson |
RTI |
919-316-3394 |
Dr. John Riccobono |
RTI |
919-541-7006 |
Dr. Emilia Peytcheva |
RTI |
919-541-7217 |
Mr. David Radwin |
RTI |
510-665-8274 |
Dr. Jennie Woo |
RTI |
510-665-8276 |
Other Contractors’ Staff Responsible for Conducting the Study
The study is being conducted for the National Center for Education Statistics (NCES), U.S. Department of Education. NCES’s prime contractor is the RTI International (RTI). Subcontractors include Coffey Consulting; Hermes; HR Directions; Kforce Government Solutions, Inc.; Research Support Services; Shugoll Research; and Strategic Communications, Inc. Consultants are Dr. Sandy Baum and Ms. Alisa Cunningham. Principal professional RTI staff, not listed above, who are assigned to the study include Mr. Jeff Franklin, Ms. Christine Rasmussen, Ms. Kristin Dudley, Mr. Brian Kuhr, and Ms. Tiffany Mattox.
Sampled institutions will be asked to provide enrollment lists that will include several data items. These enrollment lists will be used to screen for eligibility and to select the NPSAS:16 student sample. The data items, requested for each student enrolled in the time frame of interest (July 1, 2014 – June 30, 2015 for the field test and July 1, 2015 – June 30, 2016 for the full-scale study) are presented below.
Name
Social Security number (SSN)
Student ID number (if different from SSN)
Date of birth (DOB)
Student level (undergraduate, masters, doctoral-research/scholarship/other, doctoral-professional practice, other graduate)
Undergraduate degree program
Date of first enrollment
Class level of undergraduates (first year, second year, etc.)
Potential baccalaureate recipient indicator
CIP code or major
Contact information, including local and permanent street address and phone number and school and home e-mail address
Veteran status
GPA
Number of credits accumulated
Account status
Race/ethnicity
Gender
First-time doctoral student indicator
High school graduation date
Student’s high school status between 7/1/2014 and 6/30/2015
Name, SSN, student ID, and date of birth will be used for identifying the students selected for the sample. We recognize the sensitivity of requesting SSN and DOB for all students on enrollment lists, and appreciate the argument that it should be obtained only for sample members. However, collecting this information for all enrolled students is critical to the success of the study for several reasons:
Having SSN, which is used as the unique student identification number by most institutions, will ensure the accuracy of the sample. It will also be used to unduplicate the sample for students who attend multiple institutions.
NPSAS:16 will collect data from many administrative data sources on sample members to supplement data collected from students and institutions. (Record matching procedures will be described in the student OMB package that will be submitted in the fall of 2014).
Making one initial data request of institutions will minimize the burden required by participation. It is very likely that, if faced with two requests, some institutions would respond to the first request, but not to the second. Refusal to provide SSNs after the sample members are selected will contribute dramatically to student-level nonresponse because it will increase the rate of unlocatable students.
Obtaining SSNs early will allow us to initiate locating procedures early enough to ensure that data collection can be completed within the allotted schedule. The data collection schedule would be significantly and negatively impacted if locating activities could not begin at the earliest stages of institutional contact.
Schools will be asked to provide CIP code or major to allow over- and under-sampling of specific fields. Student level, class level, and baccalaureate indicator will be used to form the student strata described in section B, and identify students eligible for follow-up as part of the Baccalaureate and Beyond Longitudinal Study.
We will request locating data from institutions concurrent with the collection of student lists to allow web-based student record collection and student interviewing to begin almost immediately after sample selection, helping us meet the tight schedule for data collection, data processing, and file development. If an institution is unwilling to provide location data for all students listed on the enrollment list, we will request locating data only for sampled students immediately after the sample is selected.
With the increasing interest in veteran student success, for the field test, veteran’s status will be requested on enrollment lists to determine whether or not institutions can provide the information. Also during the field test, GPA, number of credits accumulated, and account status will be evaluated for their usefulness in accurately identifying baccalaureate recipients. As described in part B, race/ethnicity, gender, and date first enrolled at the institution will be used to determine whether or not excluding students first enrolling in May and June biases the sample. The first-time doctoral student indicator will help us explore the feasibility of a possible future study of doctoral student persistence. High school graduation date and enrollment status between July 1, 2014 and June 30, 2015 will help identify dually-enrolled students who are only eligible for NPSAS if they complete high school and subsequently enroll in postsecondary courses during the NPSAS year. Having high school information will also allow a comparison to IPEDS counts that include dually-enrolled students.
Chromy, J.R. (1979). Sequential Sample Selection Methods. Proceedings of the Section on Survey Research Methods of the American Statistical Association, 401-406.
Cominole, M., Riccobono, J., Siegel, P., and Caves, L. (2009). 2007–08 National Postsecondary Student Aid Study (NPSAS:08) Full-scale Methodology Report (2010-188) (Forthcoming). National Center for Education Statistics, Institute of Education Sciences, U.S. Department of Education. Washington, DC.
Cominole, M., Siegel, P., Dudley, K., Roe, D., and Gilligan, T. 2004 National Postsecondary Student Aid Study (NPSAS:04) Full Scale Methodology Report (NCES 2006–180). U.S. Department of Education. Washington, DC: National Center for Education Statistics.
Cominole, M., Wheeless, S., Dudley, K., Franklin, J., and Wine, J. (2007). 2004/06 Beginning Postsecondary Students Longitudinal Study (BPS:04/06) Methodology Report (NCES 2008-184). National Center for Education Statistics, Institute of Education Sciences, U.S. Department of Education. Washington, DC.
Education Sciences Reform Act of 2002, 20 U.S.C. § 9573. (2007).
Folsom, R.E., Potter, F.J., and Williams, S.R. (1987). Notes on a Composite Size Measure for Self-Weighting Samples in Multiple Domains. Proceedings of the Section on Survey Research Methods of the American Statistical Association, 792-796.
Malizio, Andrew G. (1995) Methodology Report for the 1993 National Postsecondary Student Aid Study (NCES 95-211). U.S. Department of Education. Washington, DC: National Center for Education Statistics.
Riccobono, J., Cominole, M., Siegel, P., Gabel, T., Link, M., and Berkner, L. (2005). National Postsecondary Student Aid Study, 1999-2000 (NPSAS:2000) Methodology Report (NCES 2002–152). U.S. Department of Education. Washington, DC: National Center for Education Statistics.
Riccobono, J., Whitmore, R., Gabel, T., Traccarella, M., and Pratt, D.(1997). National Postsecondary Student Aid Study, 1995-96 (NPSAS:96), Methodology Report. (NCES 98-073). U.S. Department of Education. Washington, DC: National Center for Education Statistics.
Sheperd, Jane. (1992). Methodology Report for the 1990 National Postsecondary Student Aid Study (NCES 92-080). U.S. Department of Education. Washington, DC: National Center for Education Statistics.
1 Institutions in Puerto Rico were not eligible for NPSAS:12.
2 A preliminary sampling frame has been created using IPEDS:2011-12 data, on which frame counts in table 7 are based. The frame will be re-created with the most up-to-date data prior to both the field test and full-scale sample selections.
3 There is a small chance that certain institutions may be selected for both the field test and full-scale studies, such as small systems.
4 Folsom, R.E., Potter, F.J., and Williams, S.R. (1987). Notes on a Composite Size Measure for Self-Weighting Samples in Multiple Domains. Proceedings of the Section on Survey Research Methods of the American Statistical Association, 792-796.
5 A Hispanic-serving institutions indicator is no longer available from IPEDS, so we will create an indicator following the logic that was previously used for IPEDS.
6 We will decide what, if any, collapsing is needed of the categories for the purposes of implicit stratification.
7 For sorting purposes, Alaska and Hawaii will be combined with Puerto Rico in the Outlying Areas region rather than in the Far West region.
8 All institutions will be asked to include students enrolled through April 30 in the full-scale.
9 We will ask for both student level and undergraduate degree program in the field test and consider condensing them into one field for the full-scale study.
10 In NPSAS:12, poststratification caused an increase in bias and design effects. Accounting for financial aid in the sampling stratification may help avoid these issues for NPSAS:16 poststratification.
| File Type | application/vnd.openxmlformats-officedocument.wordprocessingml.document |
| File Title | Chapter 2 |
| Author | spowell |
| File Modified | 0000-00-00 |
| File Created | 2021-01-25 |
© 2026 OMB.report | Privacy Policy