State of Preschool 2014-16 Part B and C
State of Preschool 2014-16 Part B and C.docx
State of Preschool Survey 2013-2015
OMB: 1850-0895
State of Preschool 2014-2016
Request for approval of a collection of information
Supporting Statement Part B
OMB Paperwork Reduction Act Submission
OMB# 1850-0895 v.2
Submitted by:
The National Center for Education Statistics
Institute of Education Sciences
U.S. Department of Education
February 2014
Table of Contents
B. Description of Statistical Methodology 1
B.1. Respondent Universe 1
B.2. Statistical Methodology 1
B.3. Methods to Maximize Response Rate 1
B.4. Tests of Procedures and Methods 2
B.5. Reviewing Individuals 2
Section B. Description of Statistical Methodology
B.1. Respondent Universe
The respondent universe for this study is the state preschool administrators in the 50 states and the District of Columbia. Data are collected directly from these entities through a web-based survey form. Note that in some states there are no state programs to support publicly provided early childhood education. As such, these states do not have state preschool administrator and they do not report data on the topic. More than one agency supports early childhood education programs in some states. As a result, some states will have more than one respondent. Based on the most recent collections, it is anticipated that the number of respondents to the 2014 collection will be 53 state agency representatives. Pending policy changes that might occur between now and 2016, the number of respondents for each annual collection after 2014 is expected to be the same.
B.2. Statistical Methodology
This is a universe data collection employing a survey form. All states with publicly supported early childhood education have responded to the collection effort in recent years, the most recent completed collection being 2012 (2013 data collection is currently taking place). Because the data collection is based on a universe of sample members and because of very high response rates, weighting adjustments and adjustments to variances for statistical test purposes are not necessary. However, some statistical adjustments are made to the resulting data to help unduplicate enrollment counts that can arise when the same child is enrolled in more than one publicly funded program. More specifically, when states report that they have included children with disabilities who are in special programs in the counts of preschool aged children who are in regular preschool programs, the preschool disability count is subtracted from the regular preschool enrollment counts.
B.3. Methods to Maximize Response Rate
Several steps have been taken to maximize the response to this data collection. First, the data are collected through a user-friendly web-based computer assisted interview program. While the data can take considerable effort to prepare for inclusion into the data collection tool, the web-based collection instrument allows respondents to break off and log in several times without losing previously entered information. This flexibility allows respondents to enter information as time and data availability permit. Further, respondents are offered opportunities to check previous year’s entries prior to data collection starting up and to review a current year’s entries before the data are published. The first data check acts both as a data quality control step, in terms of reminding respondents what kinds of data will be needed for the current year’s collection, and as a reminder that the current year data collection is about to begin. Allowing respondents to review current year data entry before results are published acts as another data quality control check and also provides respondents with confidence that accurate data will be reported from their respective states further garnering cooperation.
These approaches, combined with a clear understanding of how important these data are, have helped the data collection achieve a 100 percent response rate in recent data collections.
B.4. Tests of Procedures and Methods
Each year, staff at the National Institute for Early Education Research (NIEER) review changes to policies that support early childhood education at the state and federal levels. Modifications are then made to the questionnaire and the related web-based computer assisted interview (CAI) instruments to reflect these policy changes (see appendix B for the 2014 instrument and research question linkages). In addition to the policy review, respondents are sent data from the previous year’s data collection allowing them to correct errors or update information for the formal release of the data. Further, NIEER staff actively participate in the annual conference of the National Association of Early Childhood Specialists in State Departments of Education (NAECS-SDE). Attendees at the conference provide feedback to and updates for the questionnaires during these conferences. This facilitates NIEER staff learning about new or changing policies from the provider perspective.
The CAI instruments undergo extensive testing prior to the initiation of data collection. Tests are run to verify that logical skips through the instrument are functioning as expected so that respondents are not asked questions that are not meaningful based on responses to prior questions. Tests also verify that logic checks are working as expected. The checks flag inconsistent answers for respondents while respondents are entering data into the CAI. Also, prior to publication, respondents are sent current year answers for one last verification for accuracy before the data are released.
Note that this package includes the survey developed for the 2014 data collection. The surveys fielded in 2015 and 2016 will be largely the same, though some updates will be necessary. For example, the year of reference will have to be changed, and items that are no longer pertinent due to policy changes may need to be removed or modified. If changes beyond updating year references are made, the updated questionnaire will be submitted for OMB approval under a change request.
B.5. Reviewing Individuals
The individuals consulted on the design of the 2013 and 2014 survey form are as follows:
W. Steven Barnett
Director, NIEER
(848) 932-3132
Megan Carolan
Policy Research Coordinator, NIEER
(848) 932-3137
Jen Fitzgerald
Public Information Officer, NIEER
(848) 932-3138
Jim Squires
Senior Research Fellow, NIEER
(802) 734-9715
Chris Chapman
National Center for Education Statistics
U.S. Department of Education
(202) 502-7414
Libby Doggett
Deputy Assistant Secretary for Policy and Early Learning
U.S. Department of Education
(202) 205-2828
Participants in the
annual conferences for the
National Association of Early Childhood Specialists in State Departments of Education
The survey form was developed by staff and faculty at NIEER with technical input and guidance from staff at NCES. NIEER will also be responsible for collecting the data and developing initial reports, again with guidance from NCES.
State of Preschool 2014-2016
Request for approval of a collection of information
Supporting Statement Part C
OMB Paperwork Reduction Act Submission
Submitted by:
The National Center for Education Statistics
Institute of Education Sciences
U.S. Department of Education
February 2014
Table of Contents
C. Justification of the State of Preschool Questionnaire 1
List of Tables
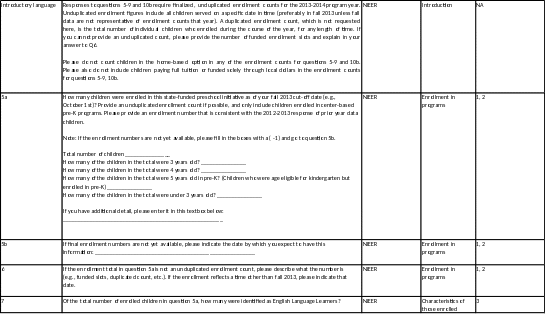
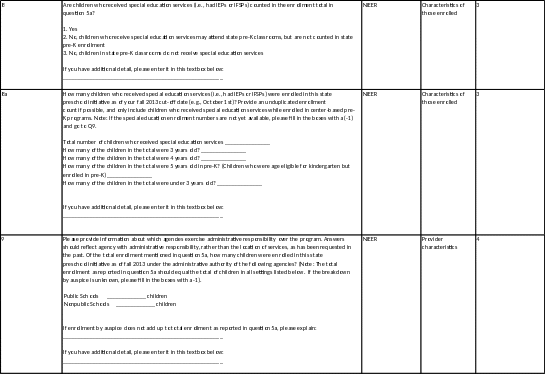
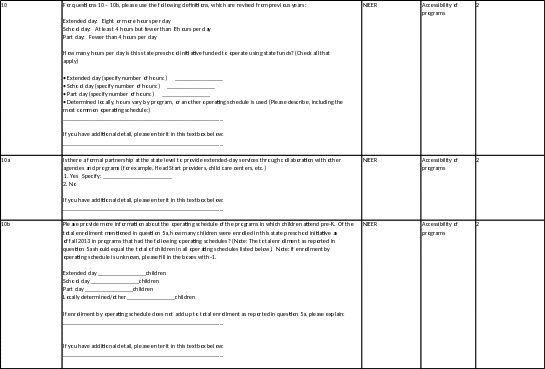
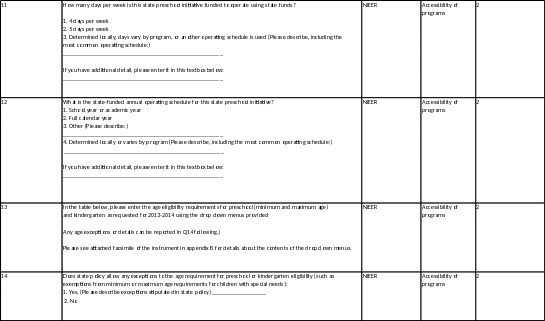
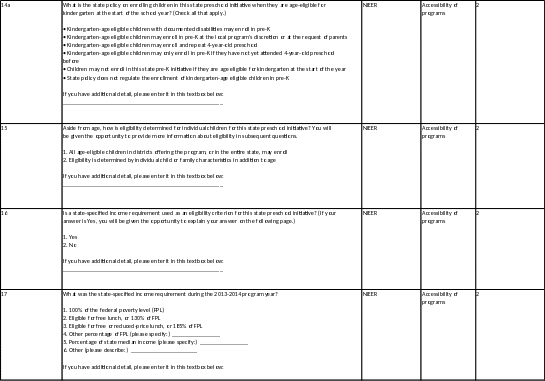
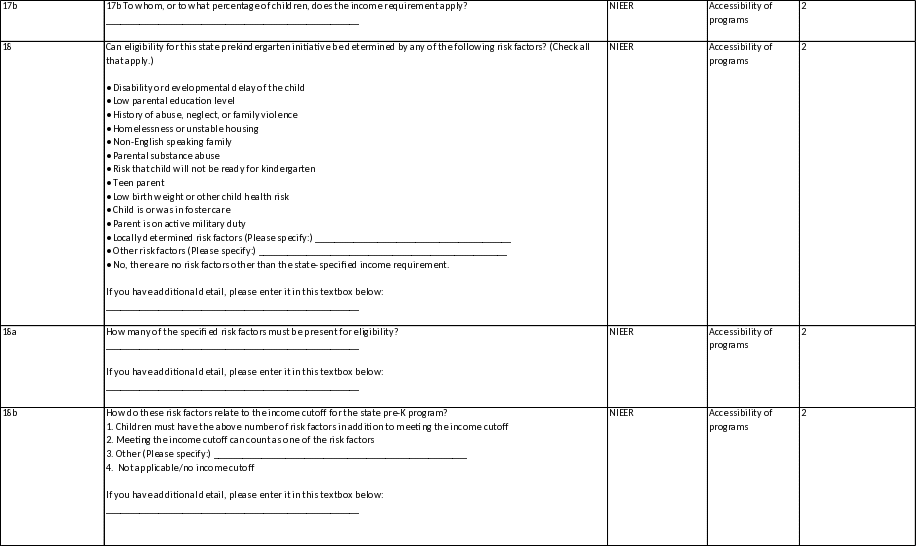
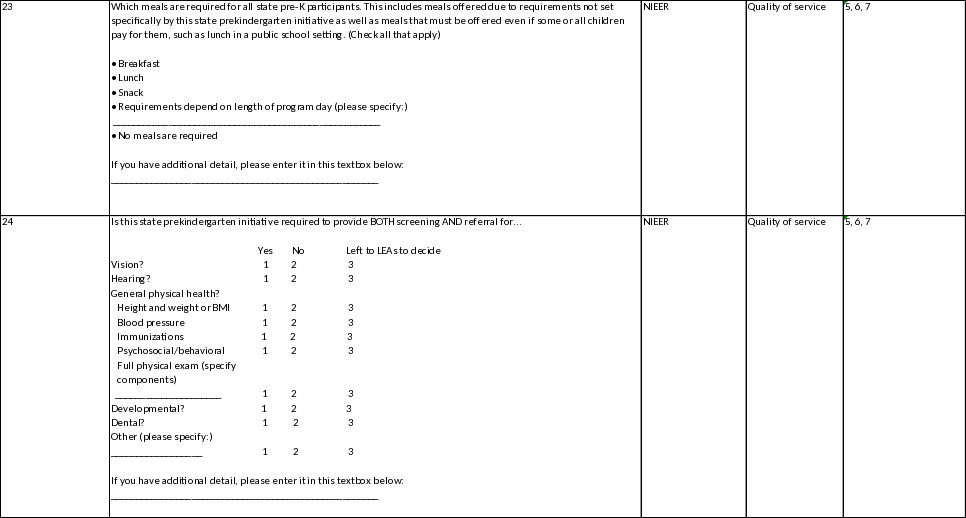
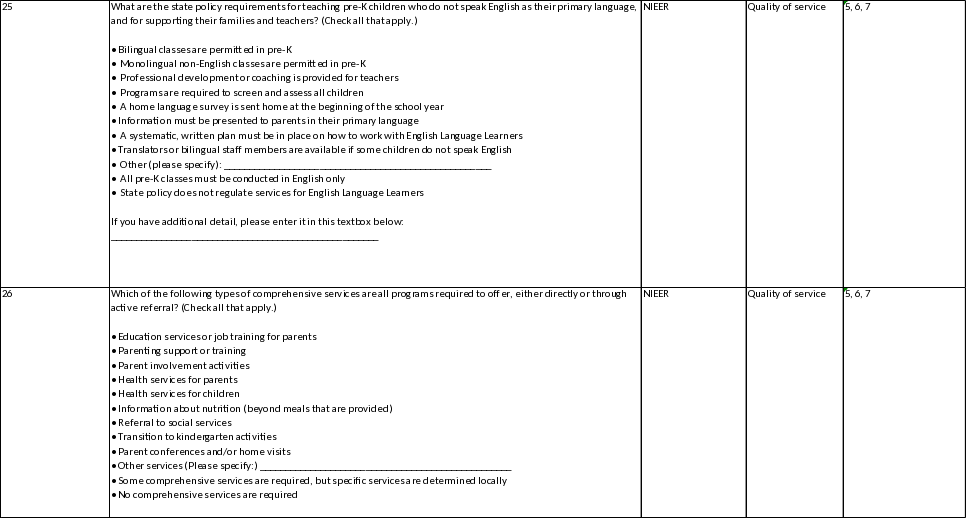
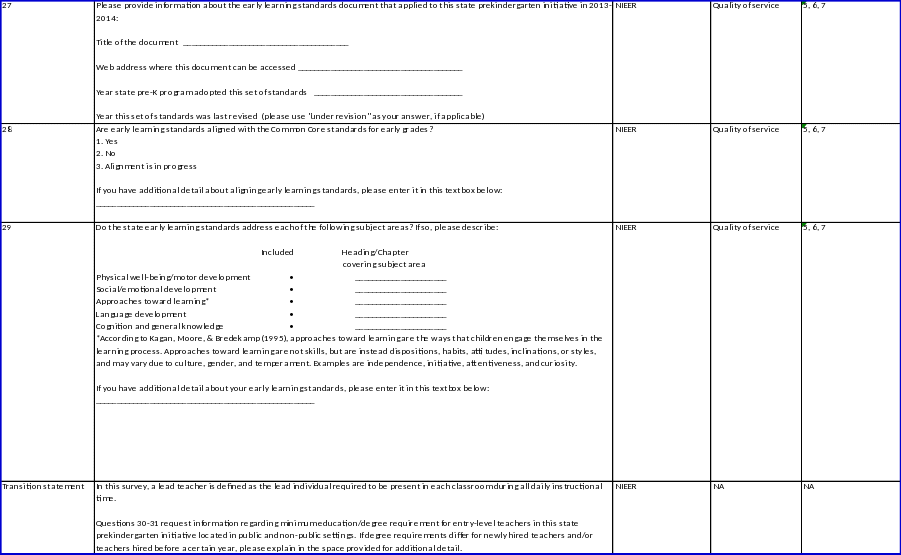
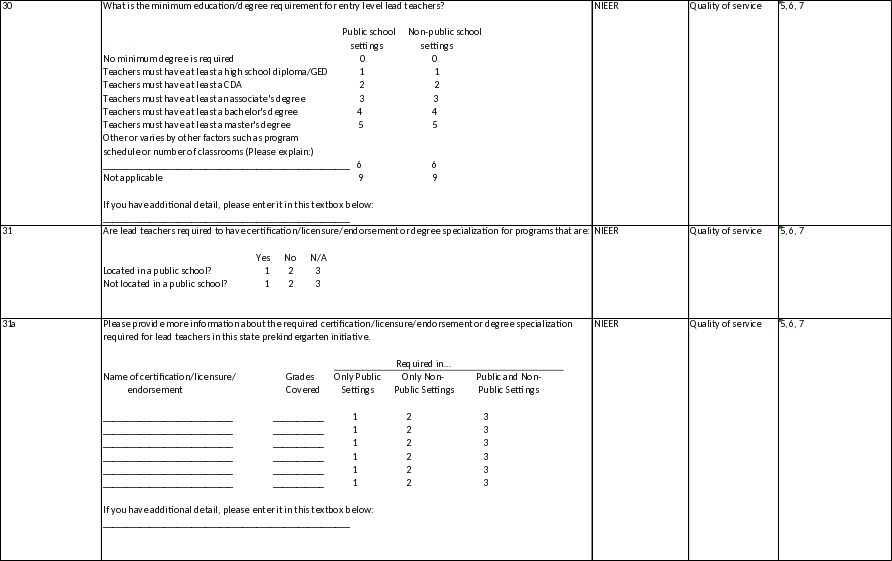
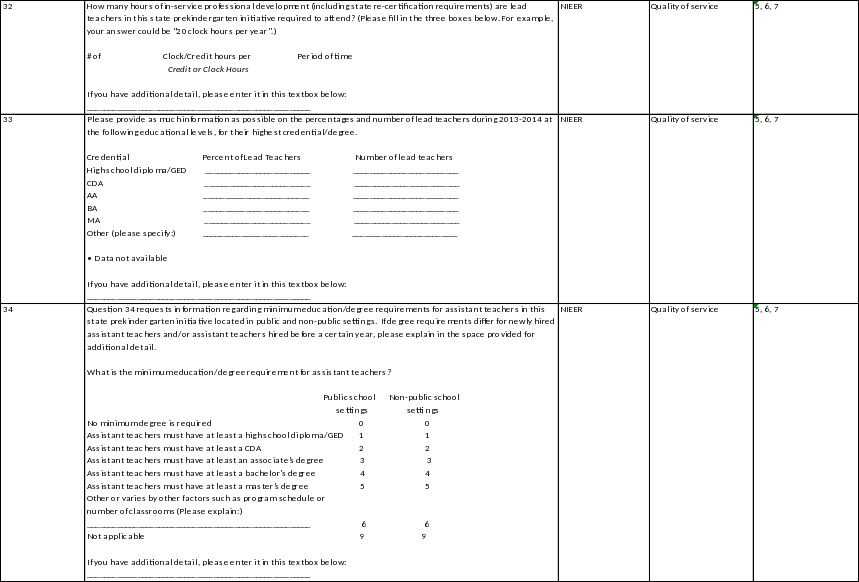
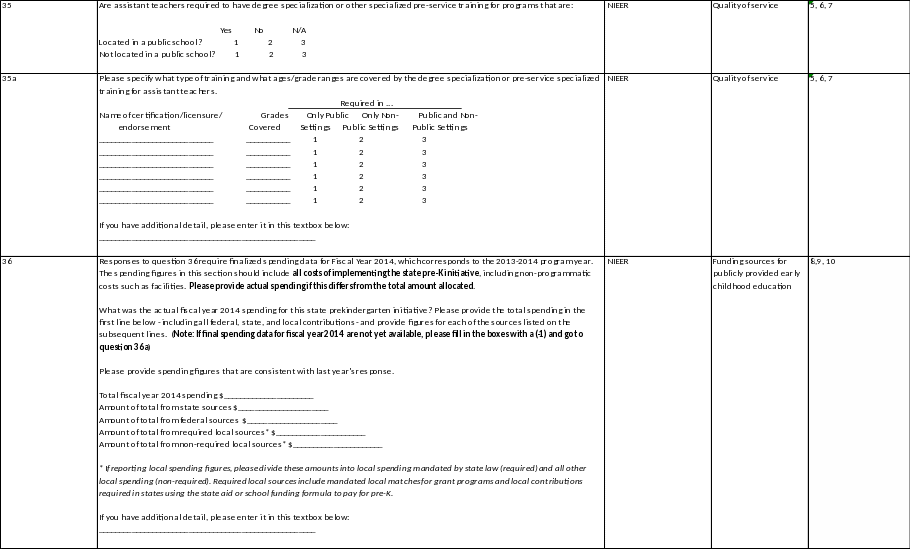
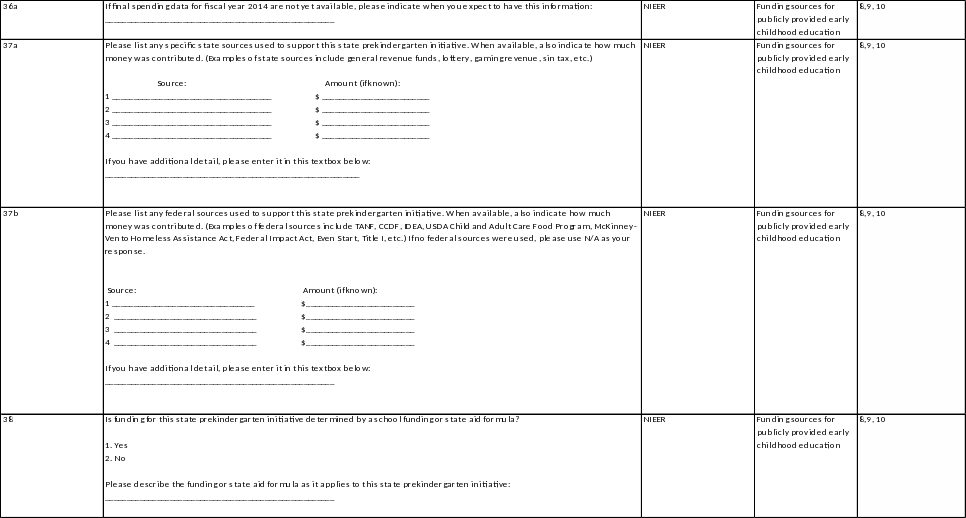
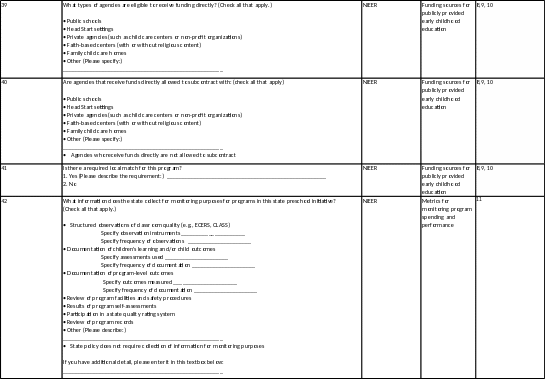
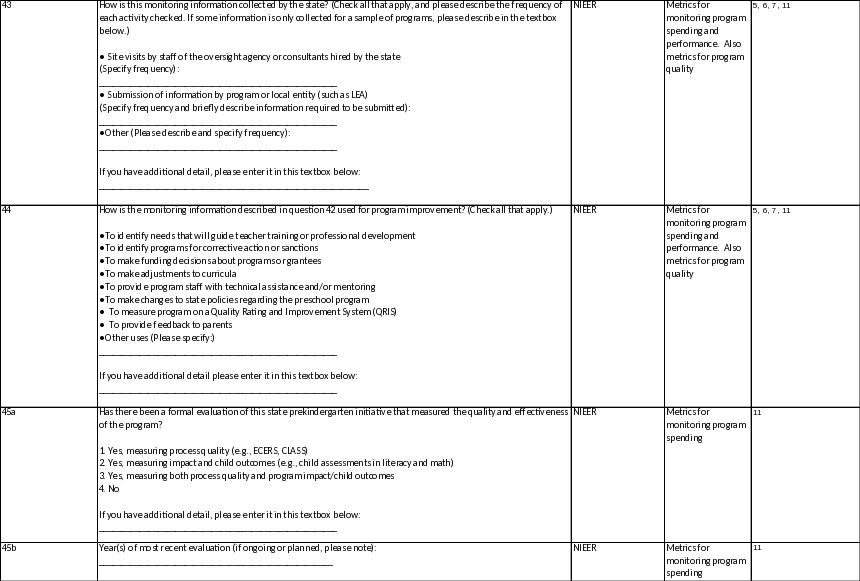
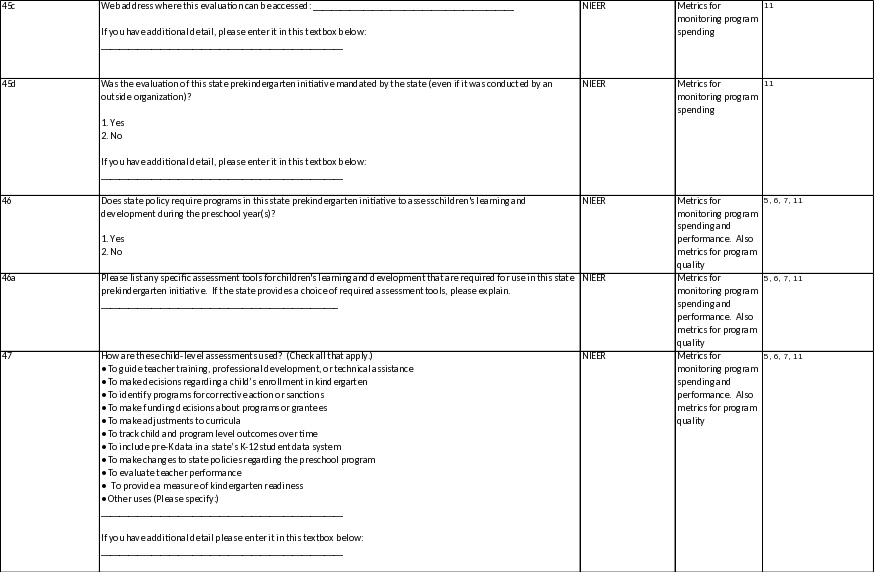
Table C1. Item-by-item descriptions of the State of Preschool questionnaire and associated
research questions and indicators 2
Section C. Justification of the State of Preschool Questionnaire – Research Questions and Indicators
The questionnaire for the State of Preschool data collections has been relatively stable over the last decade. The 2014 questionnaire is the same as that administered in 2013. Over the years, adjustments have been made as policies directly affecting the funding for and the quality of publicly supported early childhood education programs have changed across the fifty states and at the federal level. Data from the collections are used to produce a report comparing the states to one another and providing an overall national-level description of the state of preschool in the United States.
Research questions and basic indicators for which the State of Preschool is designed to address are summarized here. Following the list of research questions and indicators, table C1 links each item in the questionnaire back to the related research question or indicator.
Research questions and indicators
1. To what extent are preschool-aged children enrolling in publicly-provided early childhood education programs? Are the numbers and rates of enrollment increasing, decreasing or remaining stable?
2. Are there significant disparities in enrollment rates across the states? Within each state, is there significant variability in ease of access to programs?
3. Are children who are English language learners enrolling at similar rates as those of other children? Are children with disabilities enrolling at similar rates as those of other children?
4. How many children are attending programs in public school settings and how many are attending programs in private school settings ?
5. How many states are actively promoting policies associated with high-quality early education and care programs? What percentage of children in early education programs reside in states promoting high-quality programs as compared to the percentage of children living in states with lower standards?
6. Related to quality, which quality components are more common and which are less prevalent across the states. The study identifies 10 components that are related to important learning and health outcomes for children and that are readily measureable. This includes components that focus the implementation of comprehensive early learning standards, teacher qualifications and certifications, dosage, and class size information.
7. Over time, are there changes in terms of the quality of the state-funded preschool programs?
8. What are the sources of funding for publicly provided state-funded preschool programs? Does the distribution of funding sources vary considerably across states?
9. How much is being spent at the state and federal levels to support publicly provided preschool programs? How does this translate into spending per pupil? Does spending vary considerably by state?
10. Has spending on publicly-provided preschool changed significantly over time at the state and national levels?
11. How is spending monitored and evaluated?
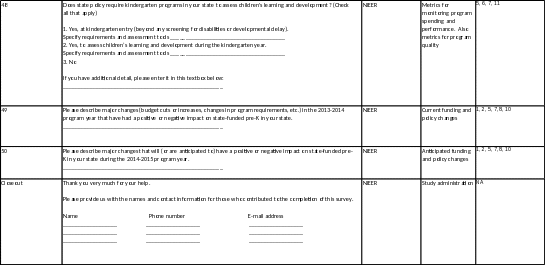
Table C1 - Item-by-item descriptions of the State of Preschool
questionnaire and associated research questions and indicators

| File Type | application/vnd.openxmlformats-officedocument.wordprocessingml.document |
| Author | Authorised User |
| File Modified | 0000-00-00 |
| File Created | 2021-01-27 |
© 2026 OMB.report | Privacy Policy