The School District Review Progrram
The School District Review Program (SDRP)
2026SDRP_RespondentGuide__ApprovedbyMgmt
The School District Review Progrram
OMB: 0607-0987
2026SDRP_RespondentGuide__ApprovedbyMgmt Instructions
for Using the Submission Log and the Geographic Update Partnership
Software (GUPS)
Instructions
for Using the Submission Log and the Geographic Update Partnership
Software (GUPS)
September 2025

This page intentionally left blank.
Table of Contents
A. School District Review Program 6
B. Mapping Coordinator Responsibilities 7
C. Types of School District Boundary Updates 8
D. Guidance for Boundary Changes 15
Part 1 What is the School District Review Program (SDRP) 16
1.2 SDRP Annotation Phase Materials 17
1.4 Description and Use of Listing Files 17
1.4.1 Inventory and Grade Range File (All States) 17
1.4.1.1 Submitting Updates to Information in the Inventory and Grade Range File 18
1.4.2 County Coverage File (All States) 18
1.4.3 Legal Government Coextensive Coverage File (Limited States) 19
1.4.4 School District to Geography (SD/GEO) Relationship File (Limited States) 19
Part 2 How to Use the TIGERweb 20
Chapter 2 Using the TIGERweb Map Viewer for the SDRP 21
2.1 Locating a School District 22
2.2 Printing and Saving a Map 27
Part 3 How to Use the Submission Log 28
Chapter 3 Using the Submission Log for the SDRP 29
3.1 School District Name Change 29
3.7 Simple Spatial Update Using Whole MCDs or Incorporated Places 32
Part 4 How to Use the Geographic Update Partnership Software (GUPS) 33
4.1 Hardware and Software Requirements 34
4.2 Download and Install GUPS 35
Chapter 5 Using GUPS for the SDRP 36
5.1 Start a New Project Using Census Web 37
5.2 GUPS Menus and Toolbars 42
5.2.1 Introducing the SDRP Toolbar 43
5.2.2 Describing the SDRP Toolbar’s Modify Area Feature Tool 46
5.2.2.1 Using the Select Feature(s) Button in the Modify Area Feature Tool 47
5.3 SDRP Updates Using GUPS 55
5.3.1 Boundary Change Basics 55
5.3.2 Load County Reference Layers 56
5.3.3 Unload County Reference Layers 57
5.3.4 Boundary Change Using Whole Faces 59
5.3.5 Add a Linear Feature to Split a Face 64
5.3.6 Delete a Linear Feature 66
5.3.7 Making Elementary and Secondary School District Boundary Changes Simultaneously 69
5.3.8 Complex Consolidation 74
5.4 Review and Validate Updates 89
5.4.1 SDRP Criteria Review Tool 89
5.4.1.1 Grade Range Overlap Error 91
5.4.1.2 Grade Range Coverage Gap Error–Incorrect Attributes 94
5.4.1.3 Grade Range Coverage Gap Error–Missing School District Geography Coverage 95
5.4.1.4 Partially Dissolved School District Error 95
5.4.1.5 Informational Warning–Non-contiguous Entities 96
5.4.1.7 Informational Warnings–Options for Viewing 97
5.4.2 Geography Review Tool 98
5.4.3 Review Change Polygons Tool 101
5.5 Export Zip Files to Share and Submit 104
5.5.1 Export a File to Share with Another Participant 104
5.5.2 Export a File for Submission to the Census Bureau 105
Part 5 How to Submit Files to the Census Bureau 108
Chapter 6 Using the Secure Web Incoming Module (SWIM) 109
Appendix A Financial Responsibility 116
A1 Pseudo School Districts 117
A2 Elementary PK/KG-12 School District 119
Appendix B Data Dictionary for the Listing Files 119
B1 Data Dictionary for the Inventory and Grade Range File 120
B2 Data Dictionary for the County Coverage File 120
B3 Data Dictionary for the Legal Government Coextensive Coverage File 121
B4 Data Dictionary for the School District to Geography Relationship File 122
Appendix C Shapefile Names 123
Appendix D Shapefile Layouts and Data Dictionary 125
Appendix E Additional GUPS Documentation 138
E2 Standard Toolbar Buttons 143
E2.1 Change the Working Directory 146
E2.3 Import Custom Shapefiles 149
List of tables
Table 1: Types of School District Updates xi
Table 2: GUPS Hardware and Operating System Requirements 17
Table 3: Steps to Download and Install GUPS 18
Table 4: Steps to Open GUPS and Start a New Project Using Census Web 20
Table 5: Steps to Save and Close a Project 24
Table 6: Steps to Open a Saved Project 25
Table 7: GUPS Main Page Elements and Their Function/Description 26
Table 8: SDRP Toolbar Buttons and Their Function/Description 26
Table 9: Modify Area Feature Tool Buttons and Their Function/Description 30
Table 10: Steps to Use the Select Feature(s) Button 31
Table 11: Steps to Load County Reference Layers 39
Table 12: Steps to Unload County Reference Layers 41
Table 13: Steps to Make a Boundary Change Using Whole Faces 42
Table 14: Steps to Add a Linear Feature to Split a Face 47
Table 15: Steps to Delete a Linear Feature One Segment at a Time 49
Table 16: Steps to Delete Multiple Segments of a Linear Feature 50
Table 17: Steps to Make Elementary and Secondary School District Boundary Changes 52
Table 18: Steps to Perform a Complex Consolidation 57
Table 19: Steps to Perform a Complex Dissolution 63
Table 20: Steps to Create a New District 68
Table 21: SDRP Criteria Review Tool Error and Warning Messages 73
Table 22: Steps to Use the SDRP Criteria Review Tool 73
Table 23: Steps to Correct a Grade Range Overlap Error 75
Table 24: Steps to Use the Geography Review Tool 81
Table 25: Steps to Use the Review Change Polygons Tool 85
Table 26: Steps to Export a File to Share with Another Participant 87
Table 27: Steps to Export a File for Submission to the Census Bureau 88
Table 28: Steps to Use SWIM 92
Table 29: Pseudo School Districts in the Inventory and Grade Range Listing File A-2
Table 30: Data Dictionary for the Inventory and Grade Range File B-1
Table 31: Data Dictionary for the County Coverage File B-2
Table 32: Data Dictionary for the Legal Government Coextensive Coverage File B-2
Table 33: Data Dictionary for the School District to Geography Relationship File B-3
Table 34: Abbreviated State Shapefile Names C-1
Table 35: Abbreviated County Shapefile Names C-1
Table 36: American Indian Areas (aial)–Legal D-1
Table 37: Census Designated Places (cdp) D-2
Table 38: County and Equivalent Areas (county) D-3
Table 39: County Subdivisions (mcd) D-4
Table 40: Incorporated Places (place) D-5
Table 41: Elementary School Districts (elsd) D-6
Table 42: Secondary School Districts (scsd) D-7
Table 43: School District Administrative Areas (sdadm)–Vermont only D-8
Table 44: Unified School Districts (unsd) D-9
Table 45: Area Landmark (arealm) D-10
Table 46: All Lines (edges) D-11
Table 48: Hydrography–Area (water) D-13
Table 49: Menu Bar Tabs and Their Function/Description E-2
Table 50: Standard Toolbar Buttons and Their Function/Description E-5
Table 51: Steps to Change the Working Directory E-8
Table 52: Steps to Import Custom Shapefiles E-11
Table 53: Table of Contents Toolbar Buttons and Their Function/Description E-15
Table 54: Status Bar Elements and Their Function/Description E-16
List of Figures
Figure 1: Boundary Change Example (Update Using GUPS) xiii
Figure 2: Complex Consolidation Example (Update Using GUPS) xiv
Figure 3: Complex Dissolution Example (Update Using GUPS) xv
Figure 4: New District Example (Update Using GUPS) xvi
Figure 5: Simple Consolidation Example (Update Using the Submission Log) xvii
Figure 6: Simple Dissolution Example (Update Using the Submission Log) xviii
Figure 9: Query Tool–Attribute Tab–Select Map 7
Figure 10: Query Tool–Query by GEOID 7
Figure 11: Task Results Tab with Query Results 8
Figure 12: Query Results–Info Panel 8
Figure 13: Map Display with Query Results 9
Figure 14: Query Tool–Query by Name 10
Figure 15: Query by Name Results 10
Figure 16: Map Display with Query Results 11
Figure 17: Print Tool Button 11
Figure 18: Print Tool Window 12
Figure 19: Example of a School District Name Change 13
Figure 20: Example of a School District Grade Range Change 14
Figure 21: Example of a SDLEA Code Change 14
Figure 22: Example of a Level Change 14
Figure 23: Example of a Simple Consolidation 15
Figure 24: Example of a Simple Dissolution 15
Figure 25: Example of a Simple Spatial Update–Boundary Change 16
Figure 26: Example of a Simple Spatial Update–New District 16
Figure 27: GUPS Main Page Elements and Default Layout 25
Figure 29: Modify Area Feature Tool 30
Figure 30: Example of a Grade Range Gap Error–Incorrect Attributes 78
Figure 31: Example of a Partially Dissolved School District Error 79
Figure 32: Informational Warning (Multiple Secondary School Districts–Single School District) 80
Figure 33: Information Warning Check Boxes 81
Figure 34: Example of a Pseudo School District–Pulaski County, KY A-2
Figure 35: Menu Bar, Standard Toolbar, and SDRP Toolbar E-1
Figure 37: Standard Toolbar E-5
Figure 38: Sub-Toolbar Markers E-5
Figure 39: GUPS Data Settings Window E-10
Figure 40: GUPS Data Settings–Clean by Project E-10
Figure 41: GUPS Data Settings–Clean by Program E-11
Figure 42: Table of Contents Toolbar E-15
Figure 43: Table of Contents with Layer Checkmarks and Arrows E-16
This guide is divided into five parts.
Part 1 What is the School District Review Program (SDRP)
Part 2 How to Use the TIGERweb
Part 3 How to Use the Submission Log
Part 4 How to Use the Geographic Update Partnership Software (GUPS)
Part 5 How to Submit Files to the Census Bureau
In addition, it has five appendices that provide supplemental information.
IMPORTANT: Images used in this guide may differ slightly from the finalized versions of software and materials. Regardless of any difference in images, the overall instruction, actions, and results that are illustrated within this document remain consistent with what is anticipated for the program.
The SDRP is a U.S. Department of Education National Center for Education Statistics (NCES) sponsored program conducted annually by the U.S. Census Bureau. It is of vital importance for the state’s allocation of federal funding under Title I of the Elementary and Secondary Education Act (ESEA) as amended by Every Student Succeeds Act of 2015, Public Law 114-95. The updated school district boundary information submitted through this program are used by the Small Area Income and Poverty Estimates (SAIPE) program in forming the Census Bureau’s estimates of the number of children aged 5 through 17 in families in poverty for each school district. These estimates are the basis of the Title I allocation for school districts in each state. School district boundaries are also used to develop estimates of social, economic, demographic, and housing conditions from the American Community Survey (ACS), and they provide essential geographic information to help education program administrators and researchers investigate location-based questions.
School districts are represented in the Census Bureau’s data according to financial responsibility. This means that the spatial representation and grade range of each school district indicate the school district that pays for the education of the students. For more information and examples of financial responsibility, see Appendix A.
The SDRP consists of two phases—Annotation and Verification. In the Annotation Phase, the Census Bureau provides mapping coordinators with current school district boundaries and associated information for their state. The Annotation Phase materials the mapping coordinator receives for the 2026 SDRP reflect the school district names, federally assigned school district local education agency (SDLEA) codes, and boundaries updated during the 2025 SDRP. Each state reviews their data and reports changes in the school district boundaries or attributes to the Census Bureau as they exist on January 1, 2026.
The review encompasses only Type 1, Type 2, and Type 3 school districts as defined by the NCES.
Type 1 is a local school district that is not a component of a supervisory union.
Type 2 is a local school district component of a supervisory union sharing a superintendent and administrative services with other local school districts.
Type 3 is an education agency that performs administrative services for more than one school district, providing a common superintendent for participating districts.
After the Census Bureau incorporates changes submitted through the Annotation Phase into the Master Address File/Topologically Integrated Geographic Encoding and Referencing (MAF/TIGER) System, mapping coordinators will review these changes for accuracy and completeness during the Verification Phase.
Each year, the NCES sends a letter to each state and the District of Columbia requesting they designate a mapping coordinator to be the primary liaison for the SDRP. It is the responsibility of the mapping coordinator to initiate and maintain contact throughout the program with local school district officials. The mapping coordinator must ensure that reviews and submissions are completed within the time frame of the SDRP.
When the mapping coordinator receives updates from local school district officials, they must review them for accuracy and completeness before submitting them to the Census Bureau. This review includes all types of updates submitted. For boundary updates, it is the responsibility of the mapping coordinator to confirm that a change is valid and all affected school districts agree to the change.
Note: The state mapping coordinators for Florida, Hawaii, Maryland, Nevada, West Virginia, or the District of Columbia, may not have any changes to submit for the SDRP. School districts in these states are all unified and county based. Unless the geographic relationship of school districts has changed in the state or a school district’s name was changed, the mapping coordinator does not have any changes to report for the 2026 SDRP. If the mapping coordinator has no changes to report, notify the SDRP team.
Once all the information is correct and in the proper format, submit this information to the Census Bureau to complete the Annotation Phase. After processing the Annotation Phase changes, the Census Bureau will create new materials for review. These new materials are reviewed as part of the Verification Phase. The mapping coordinator is responsible for reviewing and confirming the changes that appear in the verification materials and notifying the Census Bureau if there are any additional changes or corrections.
IMPORTANT: The Verification Phase is for reviewing changes submitted during the Annotation Phase and not for submitting new changes.
There are eleven types of school district updates within the SDRP as noted below in Table 1. The table includes links to examples of the types of updates and the submission method used to report them to the Census Bureau.
Table 1: Types of School District Updates
Type of Update |
Update Description |
Link to Examples |
Submission Method |
Boundary Change |
Occurs when a school district adds or removes area from the same school district level or across school district levels. |
Figure 1. Refer to sub-sections 5.3.1 through 5.3.7 for details. |
GUPS |
Complex Consolidation |
Occurs when two or more school districts merge to create a new school district with a new name and new SDLEA code, along with additional boundary changes. Note: The Census Bureau expects accompanying boundary changes for the new school district |
Figure 2. Refer to sub-section 5.3.8 for details |
GUPS |
Complex Dissolution |
Occurs when a single school district dissolves its area between two or more existing school districts, with or without additional boundary changes. Complex dissolutions do not create new school districts, and the names and SDLEA code of the receiving school districts remain unchanged. |
Figure 3. Refer to sub-section 5.3.9 for details. |
GUPS |
SDLEA Code Change |
Occurs when correcting an SDLEA code. |
Refer to sub-section 3.3 for details. |
Submission Log |
Grade Range Change |
Occurs
when a school district changes the grades it covers; for
example, changing from covering |
Refer to sub-section 3.2 for details. |
Submission Log |
Level Change |
Occurs when a school district changes classification; for example, changing from elementary to unified |
Refer to sub-section 3.4 for details. |
Submission Log |
Name Change |
Occurs when a school district changes its name; for example, changing from Oak Union Unified School District to Oak Union School District. |
Refer to sub-section 3.1 for details. |
Submission Log |
New District |
Occurs when transferring area from one or more existing school districts to form a completely new school district. |
Figure 4. Refer to sub-section 5.3.10 for details. |
GUPS |
Pseudo School District |
Occurs when one school district pays for the educational services for a set of grades in a different geographic area than its own. |
Refer to sub-appendix A1. |
Contact |
Simple Consolidation |
Occurs when two or more school districts merge to create a new school district with a new name and new SDLEA code, with no additional boundary changes. |
Figure 5. Refer to sub-section 3.5 for details. |
Submission Log |
Simple Dissolution |
Occurs when one or more existing school districts are entirely absorbed by one other existing school district. Note: Simple dissolutions retain the name and SDLEA code of the receiving school district, and do not create a new school district. |
Figure 6. Refer to sub-section 3.6 for details. |
Submission Log |
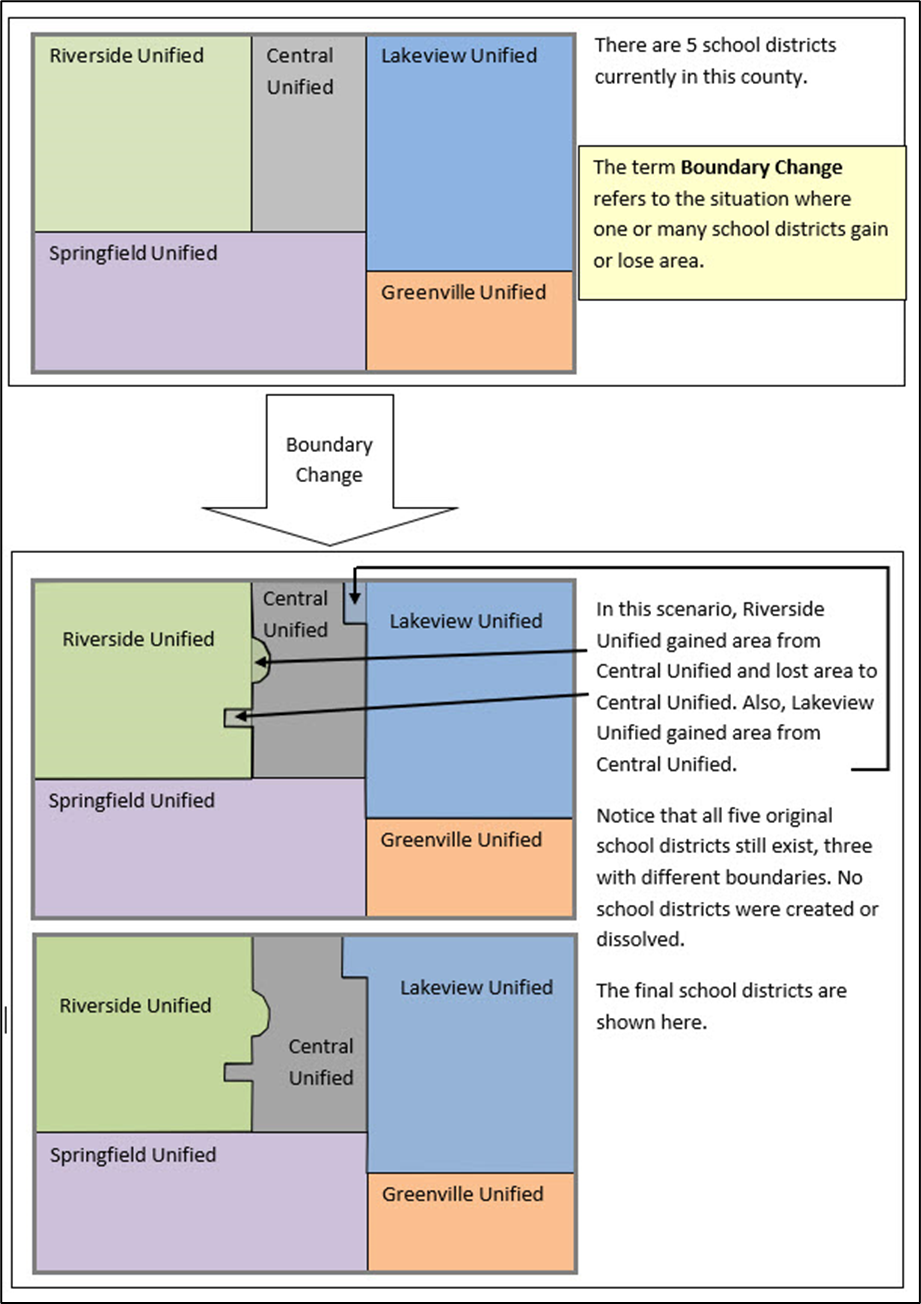
Figure 1: Boundary Change Example (Update Using GUPS)
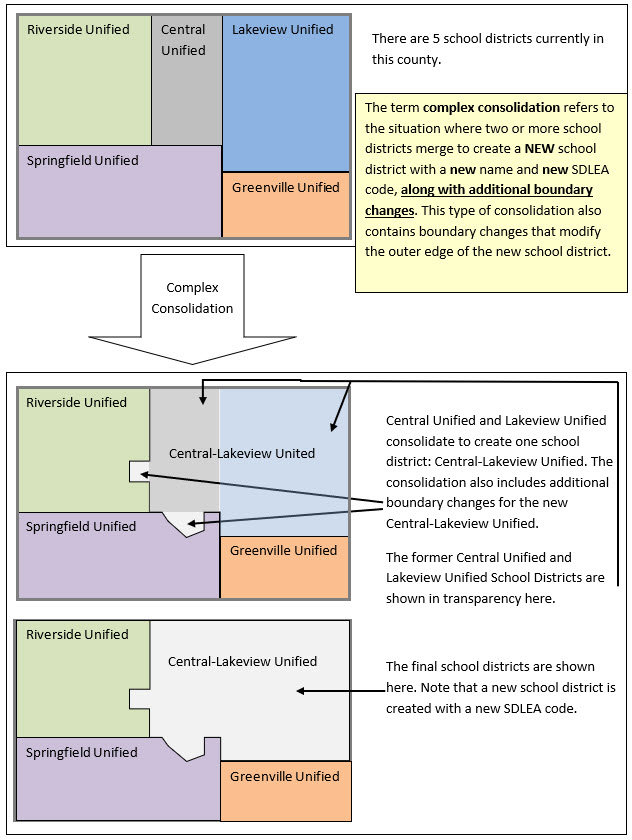
Figure 2: Complex Consolidation Example (Update Using GUPS)
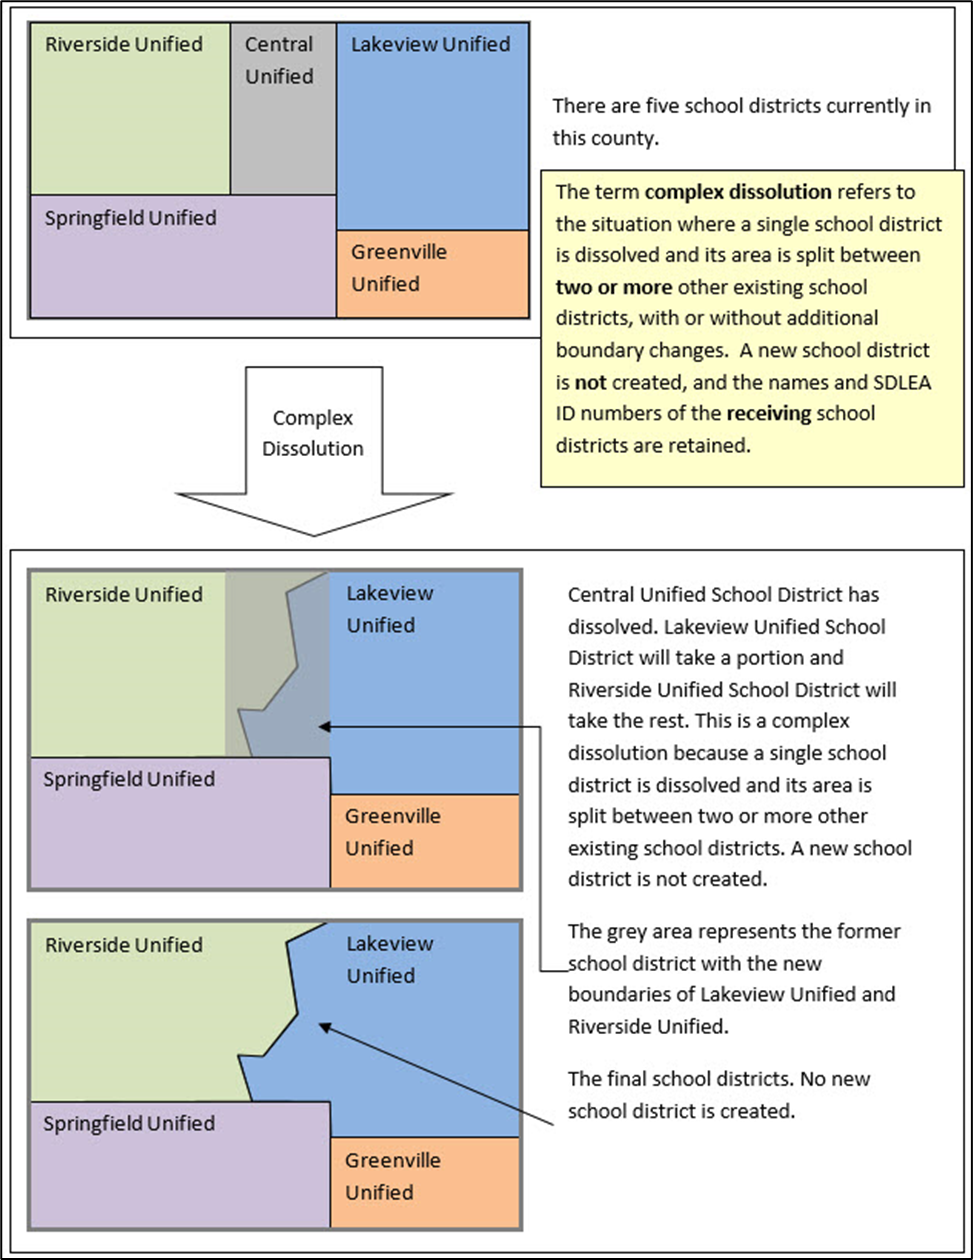
Figure 3: Complex Dissolution Example (Update Using GUPS)
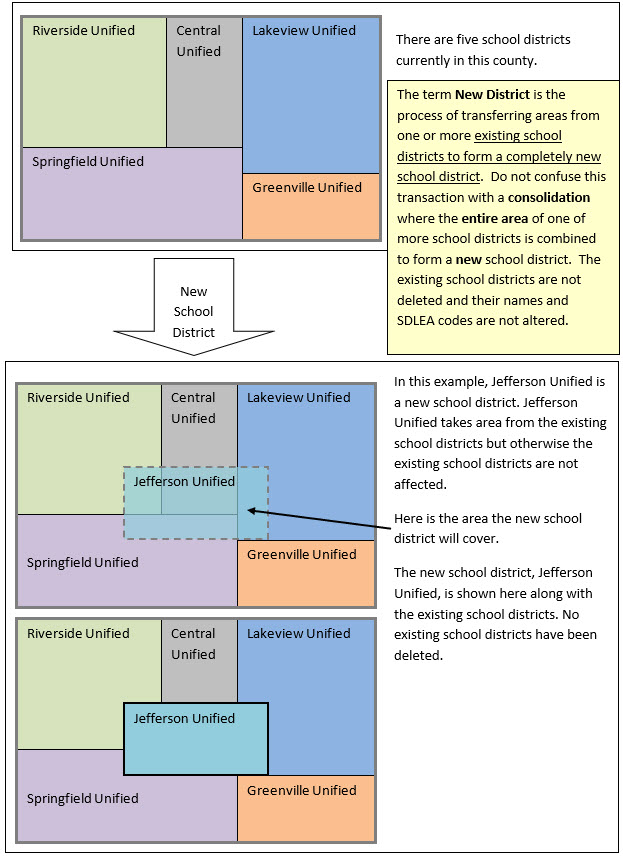
Figure 4: New District Example (Update Using GUPS)
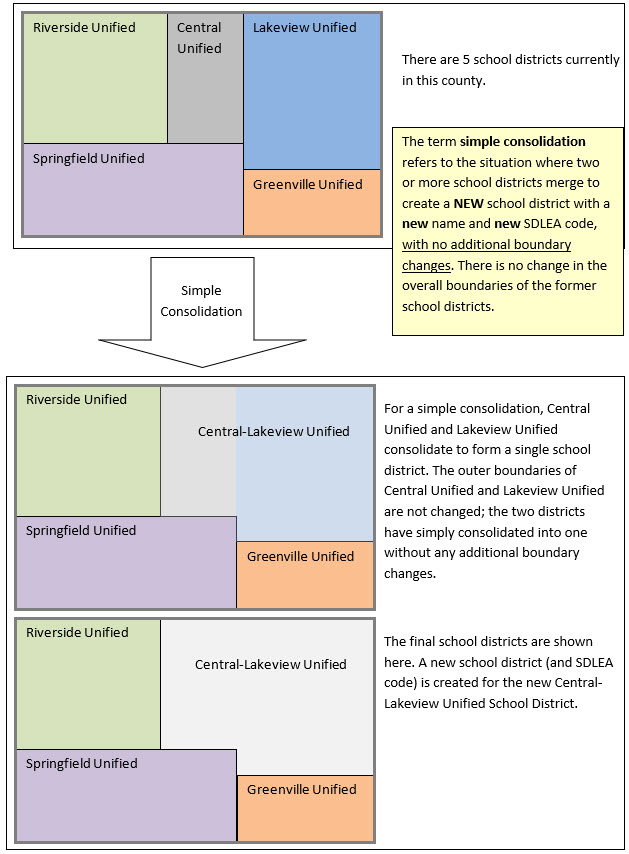
Figure 5: Simple Consolidation Example (Update Using the Submission Log)
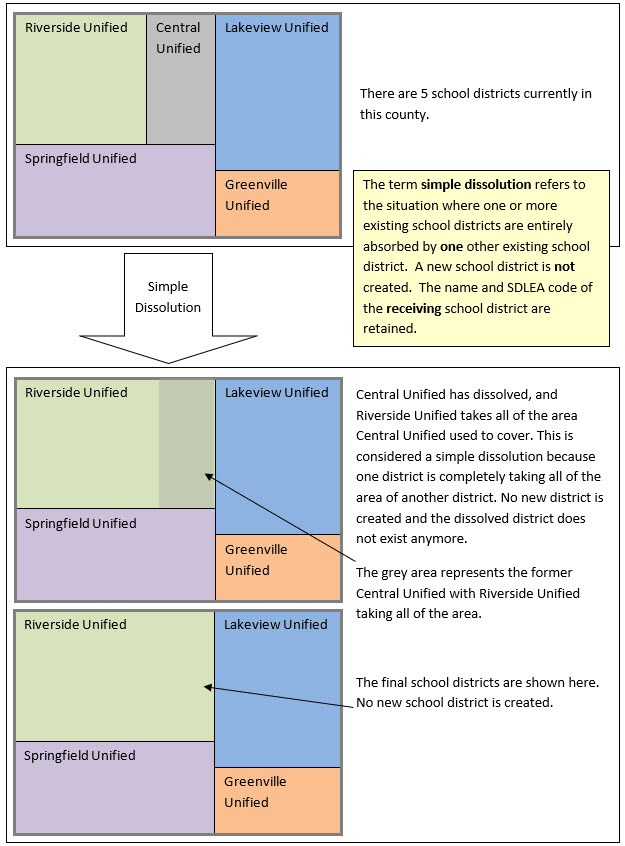
Figure 6: Simple Dissolution Example (Update Using the Submission Log)
When reviewing school district boundaries, the Census Bureau encourages the mapping coordinator to focus on updating large changes that affect housing units and population first, and then move to smaller differences if there is time before the SDRP submission deadline. The goal of the SDRP is to obtain major changes that affect population rather than small spatial corrections of boundaries.
The Census Bureau generally does not accept boundary changes of less than 30 feet when the correction does not affect housing. In remote areas with sparse population, the Census Bureau considers a difference of 60-75 feet to not be significant if housing units are not present. When reviewing source boundaries against the Census Bureau’s boundaries, if the source shows a school district boundary on a road, then use the road as it appears in the Census Bureau’s shapefile, even if the road does not seem fully spatially accurate. Road realignments are not accepted as part of the SDRP.
If there are many spatial corrections of school district boundaries for the state, the Census Bureau may be able to make these updates outside of the SDRP cycle. Please contact the SDRP team for more information.
For assistance in preparing an SDRP submission or if issues arise with the Geographic Update Partnership Software (GUPS), contact the SDRP team at the Census Bureau at <geo.school@census.gov> or 1-301-763-1099.
September 2025—Notify the mapping coordinators by email that Annotation Phase materials are available to download and review.
October 2025—Provide free training webinar on responding to the SDRP to mapping coordinators.
December 31, 2025—Deadline for submission of updated school districts. All school district updates must be received by this date to participate in the 2026 SDRP Verification Phase. We encourage you to submit changes as soon as possible rather than waiting until the deadline.
April 2026—Review of Verification Phase materials by mapping coordinators.
December 2026—Release of preliminary poverty estimates based on the updated school districts.
All SDRP Annotation Phase materials including GUPS, shapefiles, respondent guides, submission log, and school district listing files are available for download from Annotation Phase Program Materials. Review the Quick Start Guide and this guide before starting work. These guides explain the guidelines and reporting tools that apply to the state’s updates.
The Census Bureau encourages mapping coordinators to contact the SDRP team with any questions related to the program or GUPS. Additionally, valuable information is located on the SDRP website, <www.census.gov/programs-surveys/sdrp.html>.
The Census Bureau creates four listing files provided in a Microsoft Excel® (.xlsx) format.
Inventory and Grade Range File (All States)
County Coverage File (All States)
Legal Government Coextensive Coverage File (Limited States)
School District to Geography (SD/GEO) Relationship File (Limited States)
Depending on the state’s school district geography and how the state participates in the SDRP, some listing files may not be included. The following sub-sections describes each of these listings in detail. Appendix B provides greater detail in the form of individual tables that provide a data dictionary for each of the listing files.
The Inventory and Grade Range listing file is named “<ST>_SD_Inventory_A.xlsx.” This file lists the school districts reported to the Census Bureau as of the 2025 SDRP, including the school district name, SDLEA code, level, type, and grade range. Details on this specific listing file are found in sub-appendix B1.
The official school district name is its legal name including any state-used descriptive wording, such as "Independent School District", "Consolidated School District", or "Supervisory Union." The grade ranges included in these files indicate the grade ranges for which each school district is financially responsible. Use this set of grades, based on financial responsibility, to assign the data for each child to exactly one school district. For information on financial responsibility see Appendix A.
Note: The Census Bureau requires complete school district coverage; therefore, the listings may contain school districts that are not Type 1, Type 2 or Type 3. These are flagged in the listings as follows: Pseudo (A), Department of Defense (B), Interstate (C), and Bureau of Indian Affairs [BIA] (D). These files also flag school districts within a state or county that have the same name but different SDLEA codes with an (E). In these situations, the SDLEA codes are the means to identify unique school districts that share the same name. See sub-appendix A1 for more information on pseudo school districts. In areas that are not covered by any school district (i.e., national park land, the Great Lakes) the Census Bureau creates a unified school district named “School District Not Defined” with SDLEA code of 99997.
Carefully review the information contained in this file and provide the Census Bureau with updates and/or corrections. List the updates to the school district name, SDLEA code, level, type, and grade range in the submission log, as described in Chapter 3, and submit the file using the Secure Web Incoming Module (SWIM) as described in Chapter 6.
IMPORTANT: If the mapping coordinator plans to submit more than 25 updates, contact the SDRP team before completing the submission log.
The County Coverage listing file is named "<ST>_County_Coverage_A.xlsx.” This file lists school districts for each county, sorted by county. There is a separate record for each unique school district/county combination. Details on this specific listing file are found in sub-appendix B2.
The County Coverage file reflects the boundaries of the 2025 school districts as shown in the shapefiles and the TIGERweb map viewer. Use this file to locate each school district and to review the extent of the areas of each school district as they relate to counties.
Carefully review the information contained in this file and provide the Census Bureau with updates and/or corrections. Specifically review where a school district to county relationship should no longer be maintained, or where a new relationship should be created and maintained.
The Legal Government Coextensive Coverage listing file is named "<ST>_Coextensive_Coverage_A.xlsx." It is available for Alabama, Alaska, Georgia, Kentucky, Louisiana, Mississippi, North Carolina, South Carolina, Tennessee, Utah, and Virginia because some of their school districts are coextensive with general-purpose local governments such as counties or county equivalents and incorporated places. Details on this specific listing file are found in sub-appendix B3.
The Census Bureau maintains these coextensive relationships without the need for states to submit boundary changes for the listed school districts. All changes to counties or county equivalents and incorporated places are obtained through the Census Bureau's Boundary and Annexation Survey (BAS). If the mapping coordinator believes that a legal boundary is incorrect, please notify the Census Bureau at <geo.bas@census.gov>.
Carefully review the information contained in this file and provide the Census Bureau with updates and/or corrections. Specifically review where a coextensive relationship should no longer be maintained or where a new relationship should be created and maintained.
In Connecticut, Maine, Massachusetts, New Hampshire, New Jersey, Pennsylvania, Rhode Island, and Vermont, school districts are commonly coextensive with one or more incorporated places and/or county subdivisions (towns, townships, boroughs, etc.). Review the relationships listed in the SD/GEO Relationship listing file, “<ST>_SD_GEO_Relationship_A.xlsx”, to ensure that the state school districts are maintaining the correct relationships with the general-purpose local governments.
Like the County Coverage file, this file contains records for each school district/incorporated place and school district/county subdivision coextensive relationship. It is sorted by SDLEA code for use in reviewing the geographic relationship between the general-purpose local governments (towns, townships, boroughs, etc.) and each school district. Details on this specific listing file are found in sub-appendix B4.
The Census Bureau maintains these relationships without the need for states to submit boundary changes for the listed school districts. All changes to incorporated places and county subdivisions are obtained through BAS. If the mapping coordinator believes that a legal boundary is incorrect, notify the Census Bureau at <geo.bas@census.gov>.
Carefully review the information contained in this file and provide the Census Bureau with updates and/or corrections. Specifically review where a relationship should no longer be maintained, or where a new relationship should be created and maintained.
Note: If the SD/GEO Relationship File and/or a Coextensive Coverage files are not available for download, and there are school districts in the state that are legally coextensive with general-purpose local governments, contact the SDRP team.
Update the individual listing files with all changes, additions, and deletions making clear what changed by highlighting, changing text color, text bolding, adding, or crossing out the changes. Zip all the updated listing files into one .zip file and submit it to the Census Bureau using SWIM. For more information regarding SWIM, refer to Chapter 6.
The TIGERweb map viewer, reached by selecting the “TIGERweb Applications” tab once on the site, is available for state and local education officials to review the Census Bureau's school district information current as of January 1, 2025. In addition to school districts, TIGERweb also offers the ability to view:
Roads, highways, and railroads.
Boundaries for legal and statistical geographies.
Selected special land use areas such as military reservations and national parks.
Satellite imagery.
IMPORTANT: The TIGERweb User Guide is available from the TIGERweb Applications tab. Please utilize it for comprehensive details that may not be mentioned in this program specific guide.
To summarize the process, the mapping coordinators and other local education officials use the application to locate each school district and compare their boundary and attribution to a local source for school districts to determine if there is a need to make any changes. The mapping coordinator can provide boundary changes to the SDRP if the Census Bureau data does not correctly depict the school district boundary in effect as of January 1, 2026.
Note: Mapping coordinators, please provide local education officials with these TIGERweb instructions, which can be downloaded from Annotation Phase Program Materials.
To review the boundary of a school district, users need either the name of the school district or the seven-digit geographic identification code (i.e., GEOID) for the school district. The GEOID may be constructed by combining the two-digit state code and the five-digit SDLEA code from the Inventory and Grade Range File. This file is described in section 1.4.1 and detailed in appendix B1. TIGERweb uses the GEOID to zoom directly to the school district.
If a local education official determines that changes need to be reported for the 2026 SDRP, report the changes to a state SDRP mapping coordinator who will submit the changes to the Census Bureau. The mapping coordinator is the liaison between the state’s Department of Education and the Census Bureau. Find contact information for mapping coordinators on the SDRP website.
IMPORTANT: The Census Bureau will not accept school district boundary changes that are submitted by local education officials or that are annotated on maps printed from TIGERweb. The mapping coordinator must approve and submit all SDRP updates.
TIGERweb allows users to quickly locate an entity visually using the Zoom scrollbar or by using the Query tool (Figure 7) to search for a school district by its name or unique GEOID. Additional details on the Query tool are found in section 1.3.6 of the TIGERweb User Guide.
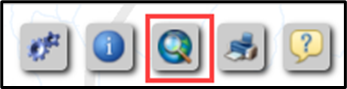
Figure 8 shows the resulting Query tool window that appears after selecting the button.
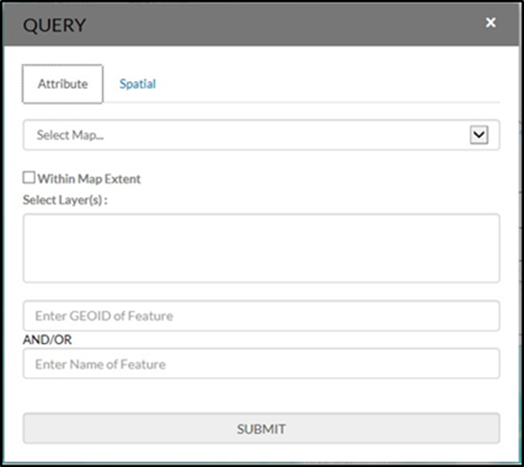
Select the Query tool from the toolbar. Select the Attribute tab from the Query tool window. From the Select Map drop-down menu, choose one of the following map services:
States and Counties to locate a county.
Places and County Subdivisions to locate a city, town, or township.
School Districts to locate a unified, secondary, or elementary school district.
Key the GEOID, derived by combining the two-digit state code and five-digit SDLEA code in the Inventory and Grade Range Listing File, in the Enter GEOID of Feature box or type all or part of its name in the Enter Name of Feature box. Enter a GEOID or a Name, but not both. Searching by unique GEOID will take users directly to the entity. Searching by Name could produce a list of school districts with the same or similar name.
Follow the steps below to locate unified school district West Prairie Community Unit School District 103, Illinois with GEOID 1700314.
Select the Query tool and the Attribute tab.
From the Select Map drop-down menu, choose School Districts (Figure 9).
From the Select Layer(s) drop-down menu, choose Unified School Districts then enter 1700314 in the GEOID field (Figure 10).
Choose SUBMIT to search for the unified school district.
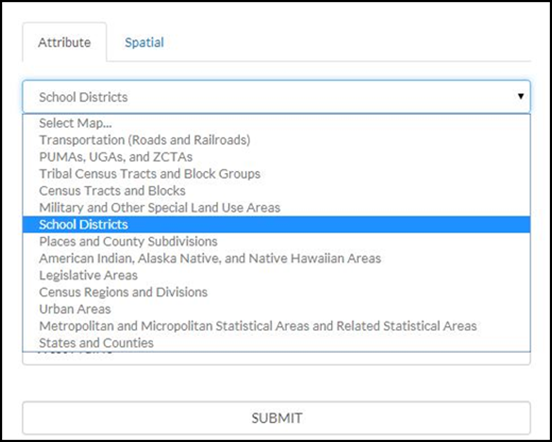
Figure 9: Query Tool–Attribute Tab–Select Map
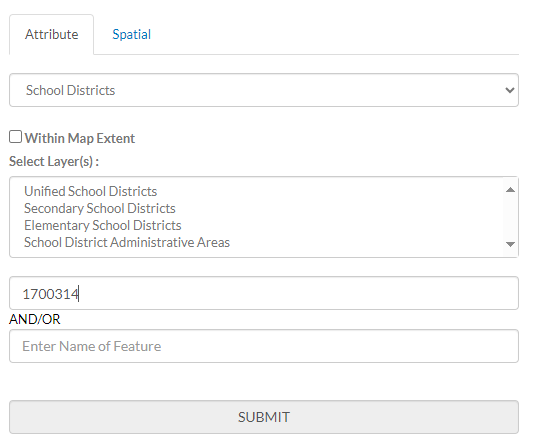
Figure 10: Query Tool–Query by GEOID
TIGERweb displays
the query results under the Task Results tab to the left of the map
(Figure 11).
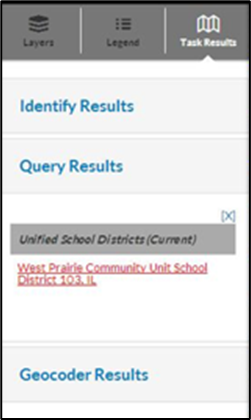
Figure 11: Task Results Tab with Query Results
TIGERweb also displays the Info panel containing attribute data for the entity (Figure 12) in a separate window. Minimize or close the Info panel by selecting the ‘-’ or ‘x’ symbol in the top right of the Info panel.
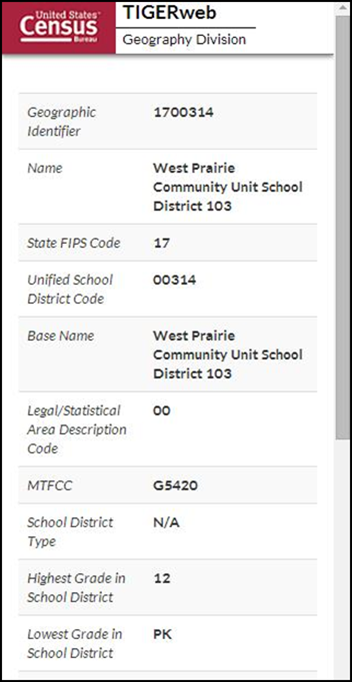
Figure 12: Query Results–Info Panel
Select the name of the result listed under the Unified School Districts heading of Query Results and TIGERweb will display the school district highlighted in the center of the map display (Figure 13). To start a new Query, select Clear Map (the ‘X’) above the Zoom scrollbar. The Query window reappears, and the located entity is no longer highlighted.
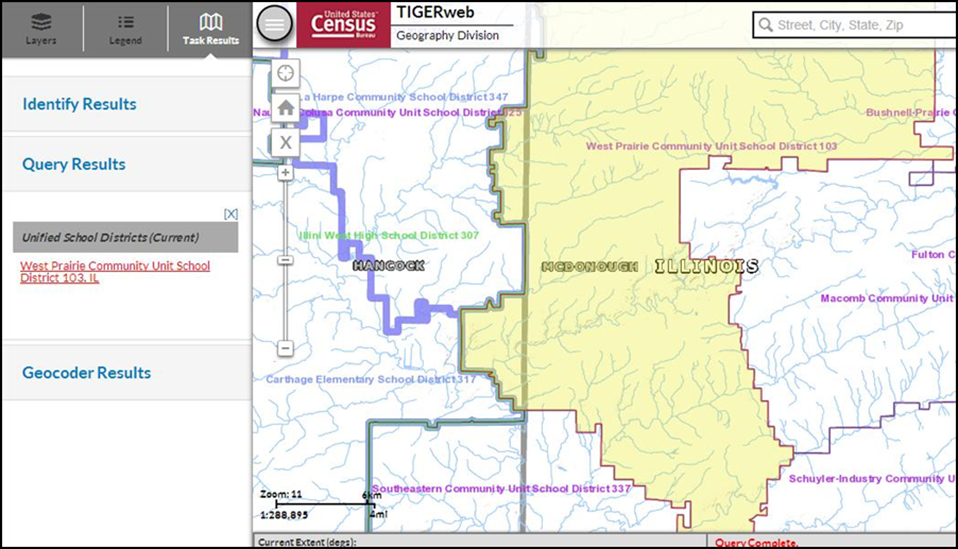
Figure 13: Map Display with Query Results
Follow the steps below to locate a school district named Bridgeport in Connecticut without knowing its school district level.
Select the Query tool.
From the Select Map drop-down menu, choose School Districts.
From the Select Layer(s) drop-down menu, hold down the Control or Shift Key and choose Unified, Secondary, and Elementary. All three will display as highlighted (Figure 14) then enter Bridgeport in the Enter Name of Feature box.
Choose SUBMIT to search.
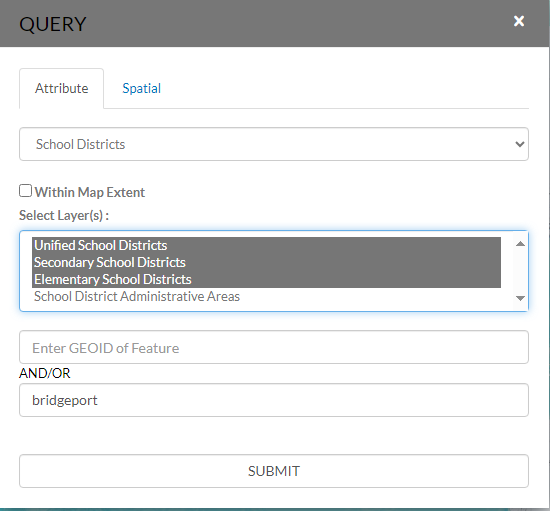
Figure 14: Query Tool–Query by Name
Searching by name could produce a list of school districts with the same or similar names, as shown in Figure 15; however, the results will include the state in which the entity is located to help choose the correct school district.
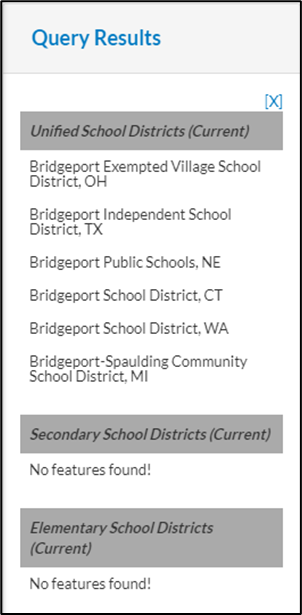
Figure 15: Query by Name Results
TIGERweb displays the selected entity highlighted in the center of the map display along with the Info panel containing attribute data for the entity. Minimize or close the Info panel to view the entire map and Query Results section (Figure 16).
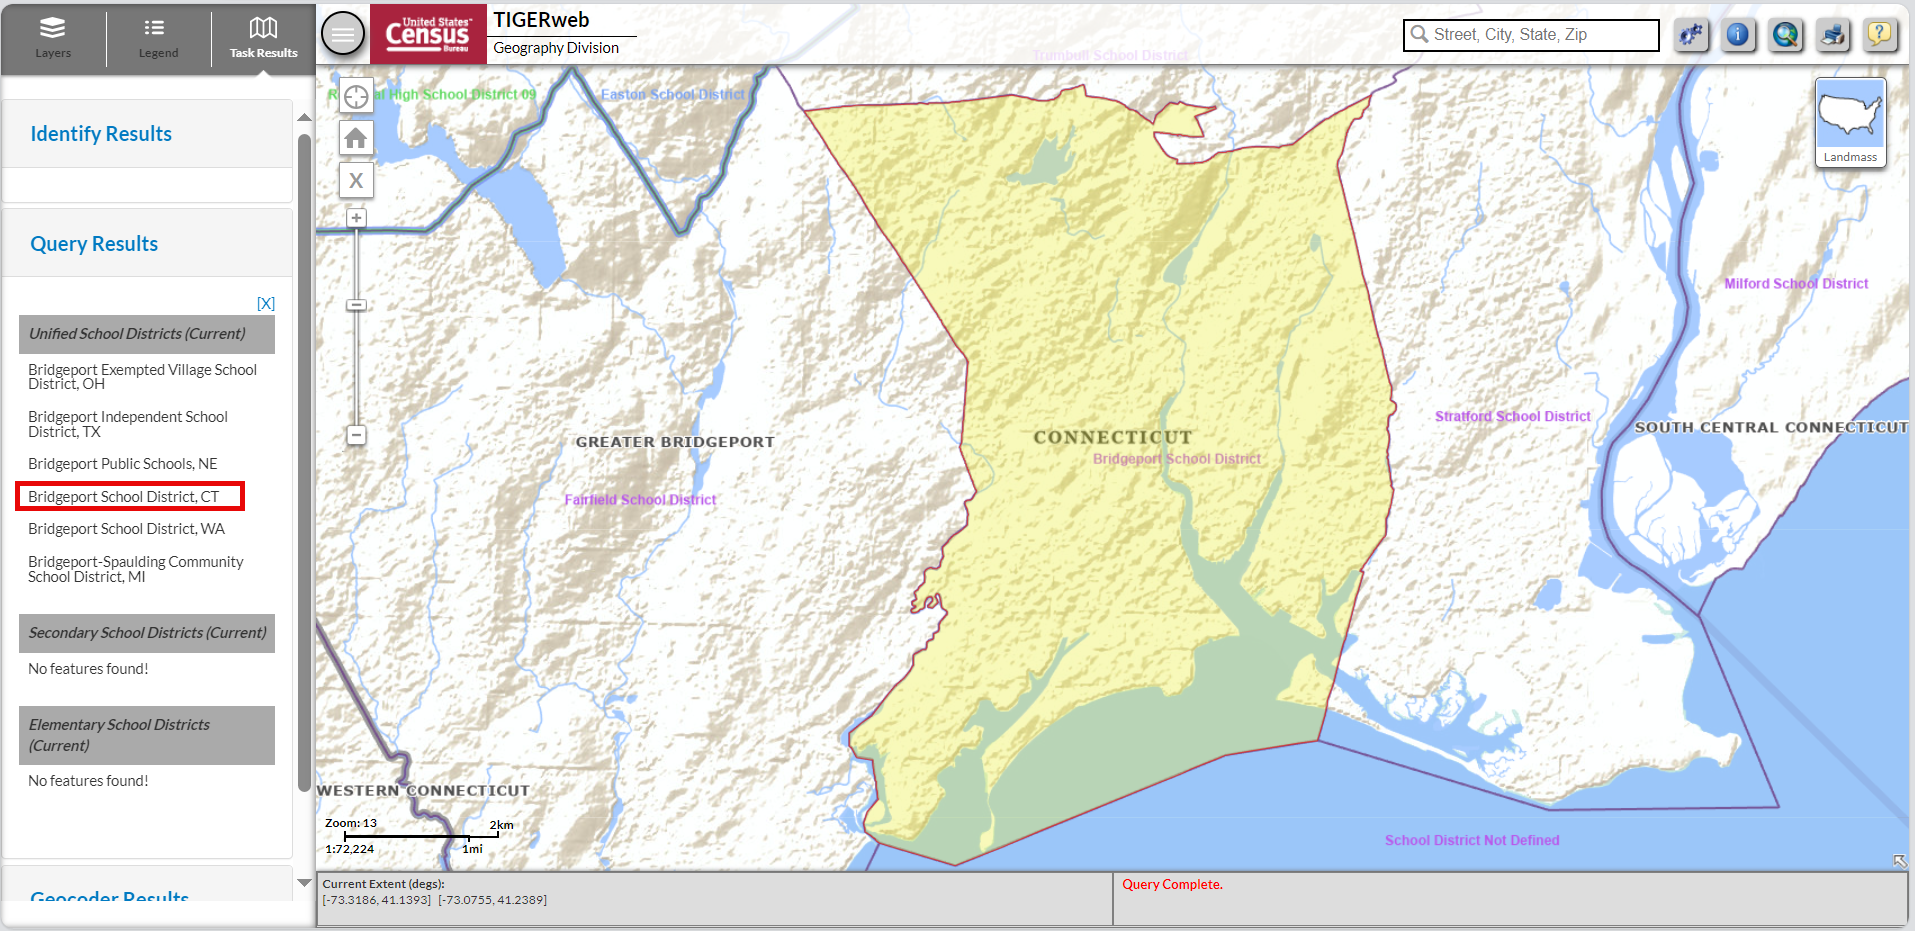
Figure 16: Map Display with Query Results
After using the Query tool to locate a school district, users can compare the TIGERweb map of the school district to a local source for the school district boundary. Provide boundary and/or attribute update information to the state mapping coordinator if the TIGERweb map does not correctly depict the school district boundary shown in a local source. Mapping coordinators prepare all school district updates for their respective states, following details in part 2 and/or 3 of this respondent guide, and submit the updates to the Census Bureau as described in part 5.
TIGERweb has the functionality to save maps, print paper maps, or capture screen images of the areas where the boundary requires an update or annotate changes. This functionality is useful for a local education official to indicate to the mapping coordinator where a school district boundary change is needed. The local official can capture a screen image and annotate the change for the mapping coordinator to approve and submit to the Census Bureau.
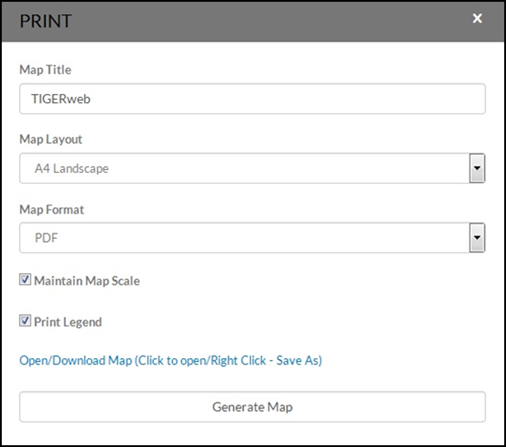
Using the Print tool button from the upper right of the map display (Figure 17) opens the Print window (Figure 18). A table with detailed instructions for the options available in this window is found in section 1.3.7 of the TIGERweb User Guide.
As a reminder, the Census Bureau will not accept boundary changes for the SDRP submitted directly to the Census Bureau annotated on maps printed using the TIGERweb map viewer.
The submission log is an Excel spreadsheet used to report nonspatial and simple school district updates. It is available for download from Annotation Phase Program Materials. Record each type of acceptable school district change as a separate record in this file.
The Census Bureau requires the use of the submission log for the following seven change types:
School district name.
Grade range.
SDLEA code.
Level.
Simple consolidations.
Simple dissolutions.
Simple spatial update using whole MCDs or incorporated places.
Note: Not all fields in the submission log are displayed in the examples in this chapter.
A school district name change is usually a result of a misspelling or legal school district name change. Figure 19 shows an example of the fields requiring information. They are the Type of Change, County code(s), SDLEA of Change, Old Name, and New Name fields. Contact the SDRP team if seeking to submit more than 25 name changes.
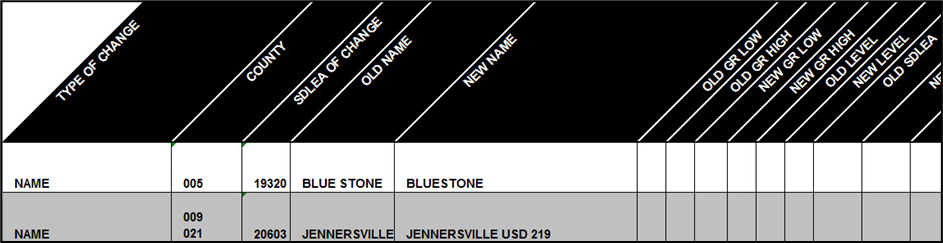
Figure 19: Example of a School District Name Change
A grade range change is the result of an incorrect grade range previously reported to the Census Bureau or a new change (e.g., changing from Kindergarten to Pre-Kindergarten). Gaps and overlaps in grade range coverage cannot exist. Grade range changes require information in the Type of Change, County code(s), SDLEA of Change, Old Grade Range Low, Old Grade Range High, New Grade Range Low, and New Grade Range High fields (Figure 20). Contact the SDRP team if seeking to submit more than 25 grade range changes.
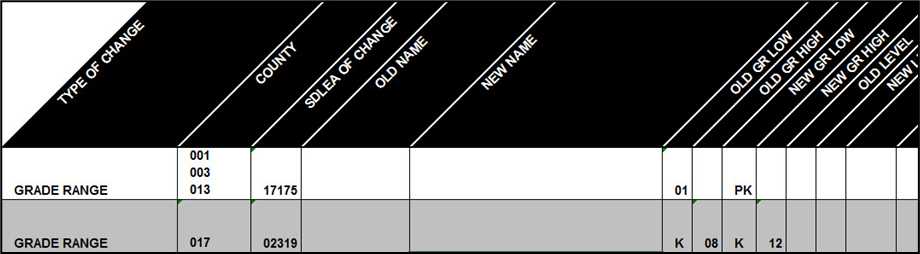
Figure 20: Example of a School District Grade Range Change
SDLEA code changes include a correction to the SDLEA code. SDLEA code changes require information in the Type of Change, County code(s), SDLEA of Change, Old SDLEA (same as SDLEA of Change), and New SDLEA fields (Figure 21).
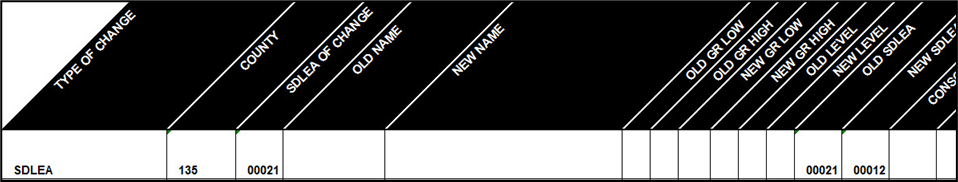
Figure 21: Example of a SDLEA Code Change
A level change occurs when a school district changes classification; for example, changing from elementary to unified. Level changes require information in the Type of Change, SDLEA of Change, Old Level, and New Level fields (Figure 22).
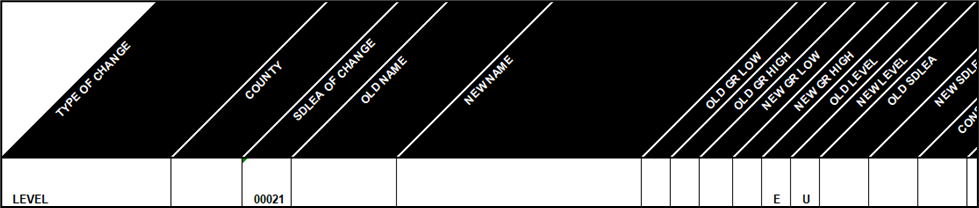
Figure 22: Example of a Level Change
A simple consolidation occurs when two or more school districts merge, or consolidate, to create a new school district with a new name and new SDLEA code. There are no additional boundary changes.
Simple consolidations require information in the Type of Change, County code(s), New Name, New Grade Range Low, New Grade Range High, New Level, Consolidation 1 SDLEA (SDLEA code of first school district being merged), Consolidation 2 SDLEA (SDLEA code of other school district being merged), Consolidation New SDLEA (SDLEA code of newly formed school district, if known; otherwise place “unknown” in this field), and Narrative/Description fields (Figure 23).
Note: The fields for Consolidation 3 SDLEA and Consolidation 4 SDLEA only require information if three or more school districts are consolidating (merging). If five or more school districts are consolidating, enter the remaining SDLEA codes on the next row starting in the Consolidation SDLEA field.
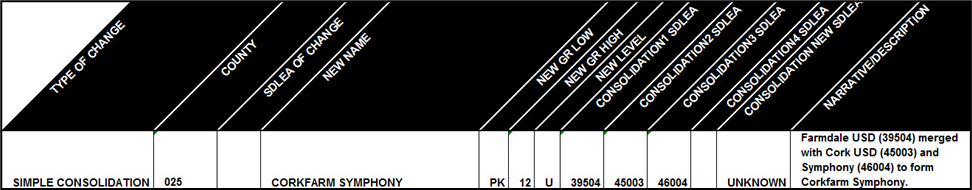
Figure 23: Example of a Simple Consolidation
A simple dissolution occurs when one or more existing school districts entirely dissolve(s) into one other existing school district. A simple dissolution never results in the creation of a new school district. The receiving school district retains its name and SDLEA code.
Note: A separate entry is required for each school district that dissolves into the existing school district through this change.
Simple dissolutions require information in the Type of Change, County code(s), SDLEA of Change (SDLEA code of school district that is gaining area), Added Area SDLEA (same as SDLEA of Change), Deleted SDLEA (SLDEA code of school district being dissolved), and Narrative/Description (include county code(s)) and if applicable, the Old Grade Range Low, Old Grade Range High, New Grade Range Low, New Grade Range High, Old Level, and New Level fields (Figure 24).
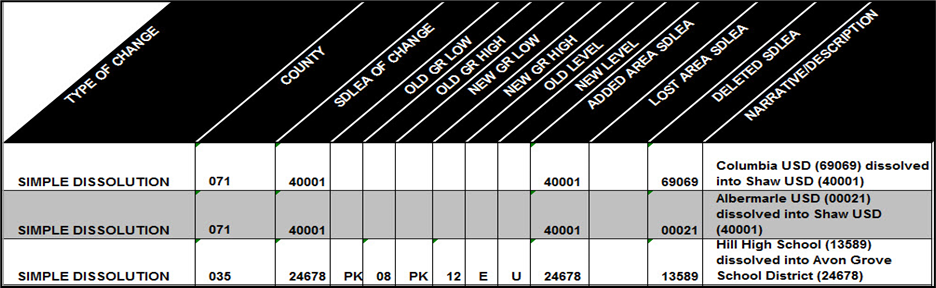
Figure 24: Example of a Simple Dissolution
Note: Complex consolidations, complex dissolutions, and boundary changes all require updates using GUPS. Review Chapter 5 to learn how to complete these types of updates.
A simple spatial update occurs when the area that is being added to a school district is also an existing minor civil division (MCD) or incorporated place in the Census Bureau’s data. Simple spatial updates can include a change to the boundary of an existing school district or the creation of a new district. These updates may be submitted using the submission log since whole geographies are being moved to the school district. If preferred, these simple spatial updates may also be submitted in GUPS.
Simple spatial updates involving school district boundary changes, shown in Figure 25, require information in the Type of Change, County code(s), Added Area SDLEA, Lost Area SDLEA, and Narrative/Description fields. The Narrative/Description field must contain the MCD(s) or incorporated place(s) that are being added to the school district.
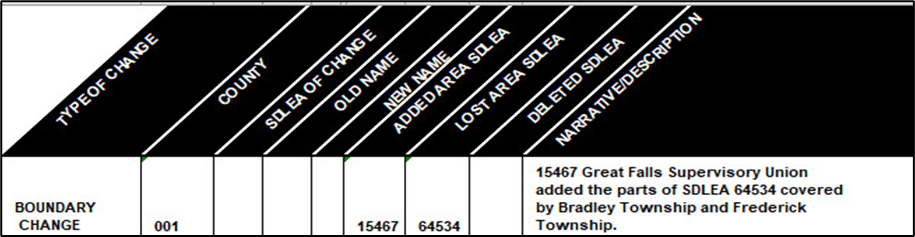
Figure 25: Example of a Simple Spatial Update–Boundary Change
Simple spatial updates involving the creating of a new school district, shown in Figure 26, require information in the Type of Change, County code(s), New Name, New GR Low, New GR High, New Level, New SDLEA and Narrative/Description. The Narrative/Description field must contain the MCD(s) or incorporated place(s) that make up the new school district.
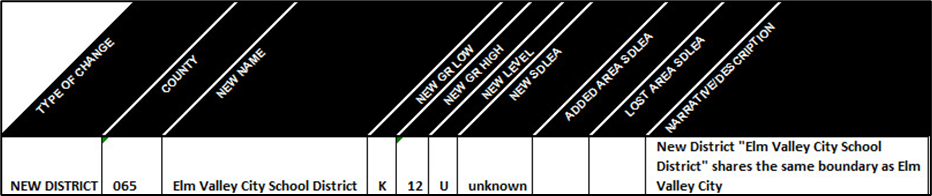
Figure 26: Example of a Simple Spatial Update–New District
Once all updates are complete, zip the submission log and submit it to the Census Bureau following instructions outlined in Chapter 6. Proceed to the next part of the guide to learn more about using GUPS for the SDRP.
GUPS is available for download from Annotation Phase Program Materials (census.gov). It operates using QGIS (formerly known as Quantum Geographic Information System (GIS)), a free and open-source desktop geographic information system application. To learn more about QGIS visit <www.qgis.org/en/site/>.
This part of the guide includes information needed to use GUPS. It offers a description of the software and gives specific instructions (in the form of Step-Action/Result tables) on using GUPS to make SDRP updates.
Chapter 4:
Lists the hardware and software requirements for GUPS.
Provides instructions for installation.
Chapter 5:
Provides instructions to open GUPS and start a new SDRP project.
Explains the GUPS interface.
Gives instructions to make required and optional updates.
Provides instructions to share and export Zip files.
GUPS was developed for use on a desktop PC or a network environment. Before beginning the installation, ensure that the computer used meets the minimum hardware and operating system requirements listed in Table 2.
Table 2: GUPS Hardware and Operating System Requirements
Hardware/Operating System |
Requirement |
Hardware: Minimum Disk Space to Install and Run GUPS |
4 GB |
Hardware: Disk Space to Store Shapefiles |
Varies by state |
Hardware: Minimum Random-Access Memory (RAM) to Run GUPS |
4 GB |
Hardware: Recommended RAM to Run GUPS |
8 GB or more for optimal performance |
Operating System: Windows® |
Windows 10 or 11 |
Operating System: Apple® |
The use of Mac is not recommended for GUPS.
|
To complete the installation, follow the steps in Table 3.
Note: If an older version of GUPS exists on the computer, the installer will automatically remove the old version before it installs the latest version. For users with QGIS 3.34.3 already installed, select the Cancel button on the QGIS 3.34.3 Setup screen (part of Step 1 below) to update GUPS without reinstalling QGIS 3.34.3. The setup will bypass the QGIS installation and immediately begin to update the GUPS plugin supported for this year’s SDRP. This is only applicable for existing installations of QGIS 3.34.3.
Table 3: Steps to Download and Install GUPS
Step |
Action and Result |
|
To successfully install QGIS and GUPS, the software must be installed under the user profile of the person that will be using QGIS/GUPS. Otherwise, the user will encounter errors accessing folder directories and plugins required for GUPS to function. If a user does not have the ability to install software using their login credentials, temporary administrative privileges will need to be granted for that user to install QGIS/GUPS. Coordinate with local Information Technology (IT) staff to acquire administrator privileges and for any further assistance with installation. If installation problems remain, contact the SDRP team. |
Step 1 |
Download GUPS from Annotation Phase Program Materials on the SDRP website and unzip the downloaded .zip file. Double-click the left mouse button on the file named SETUP-<version>.bat. Follow the on-screen installation instructions. Note: Regardless of the version number, there will be only one SETUP.bat file to choose. |
Step 2 |
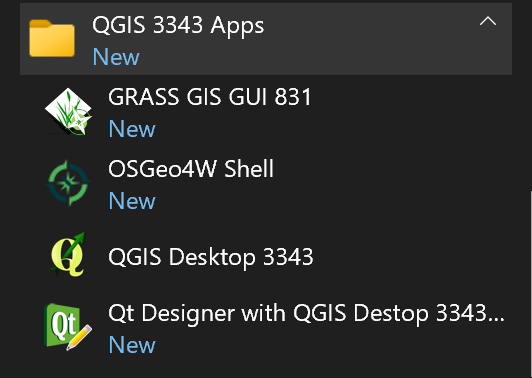
Once installed, QGIS appears in the Start Menu’s All Programs list. Please note depending on operating system, the image shown below may vary slightly.
|
|
The installer will include additional open-source software packages. This additional software will not be used during the SDRP. |
With GUPS installed, the SDRP updates can begin. There are three options to retrieve shapefiles when starting a new project:
CD/DVD (not applicable for the SDRP).
My Computer (if the shapefiles exist on an internal or external hard drive).
Census Web (loads shapefiles directly into GUPS from the Census Bureau website).
Table 4 shows the steps to open GUPS and start a new project using the Census Web option. The other two options are not covered in this material. For more information on the shapefiles used for the SDRP see Appendix C and Appendix D.
To open GUPS and start a new project using the Census Web option, follow the steps below.
Table 4: Steps to Open GUPS and Start a New Project Using Census Web
Step |
Action and Result |
Step 1 |
Select QGIS Desktop 3.34.3 from the Start Menu. The QGIS splash screen appears. Depending on the age of the computer and the amount of RAM, the application may require a few moments to load and open.
|
Step 2 |
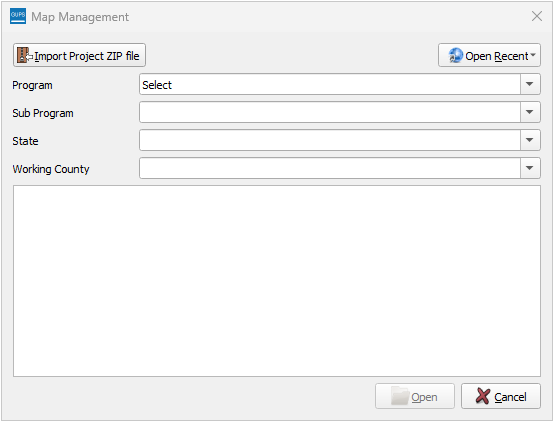
The Map Management window appears.
|
|
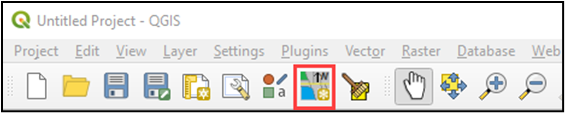
If the Map Management window does not appear, choose the Map Management button from the Standard toolbar (shown below highlighted by a red rectangle). If the Map Management button does not exist in the Standard toolbar, contact the SDRP team.
|
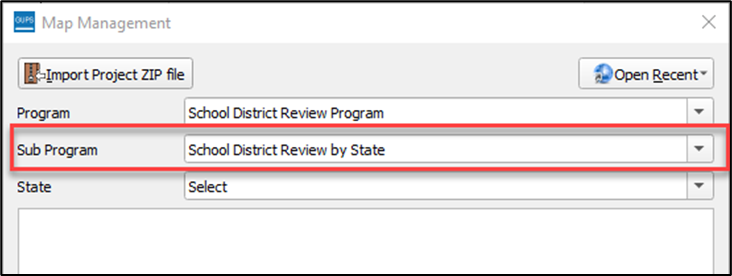
Step 3 |
In the Map Management window, use the drop-down menu next to the Program field to select School District Review Program and then select School District Review by State for the Sub Program field.
|
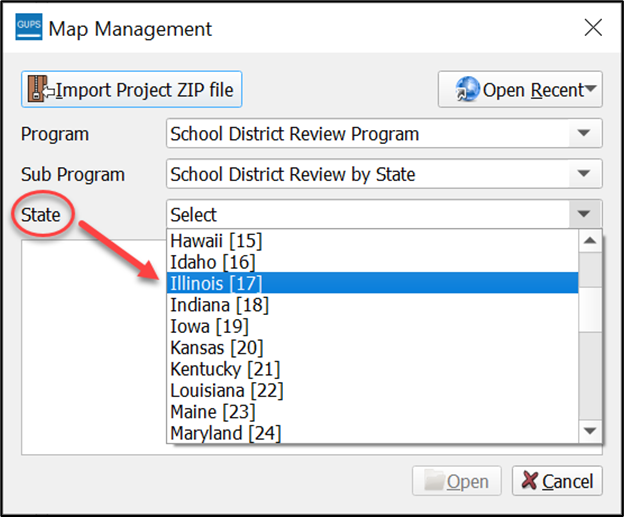
Step 4 |
In the State field, use the drop-down menu to select a state. Use the scroll bar to move up and down the list of states. This example uses Illinois.
|
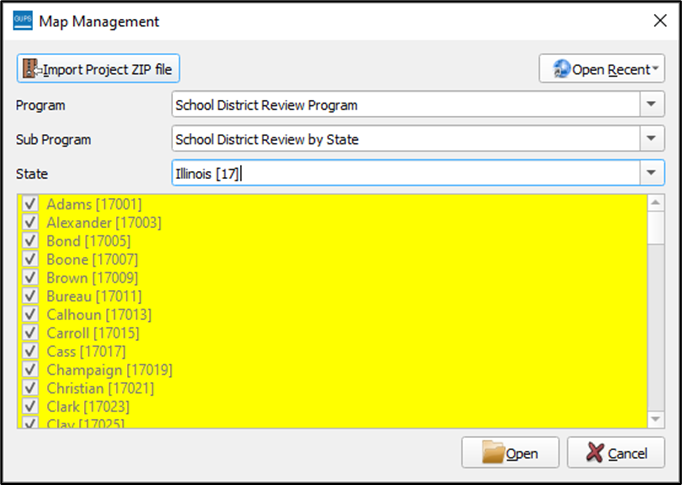
Step 5 |
After selecting a state, GUPS refreshes the Map Management window and automatically highlights all available counties for the state of Illinois. Select Open.
|
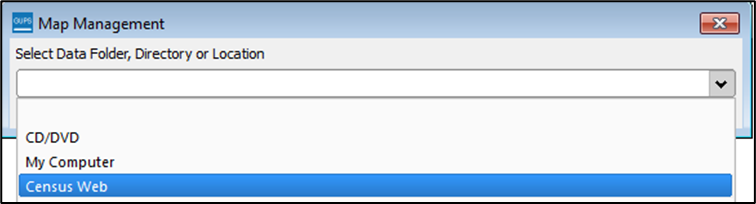
Step 6 |
A secondary Map Management window appears to select the data source. From this secondary Map Management window, choose Census Web to download the shapefile data layers with preset symbology and labels directly into GUPS.
|
|
GUPS only prompts for a data download location once per project. When a project has been closed and reopened, the shapefiles automatically load, even if no changes were made during the first session. |
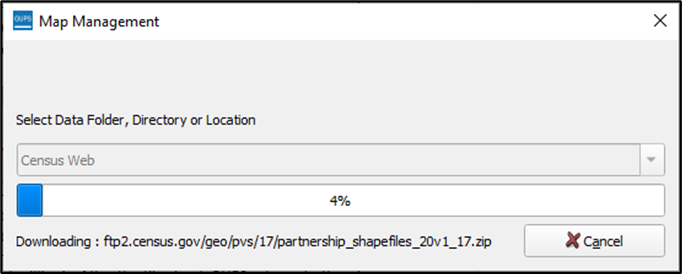
Step 7 |
When Census Web is chosen, the shapefiles for the state begin to load with a progress bar displaying the percentage of the upload completed.
|
Step 8 |
GUPS unzips and copies the files to the GUPS home directory then loads them into the application. Once loaded, the Table of Contents populates and symbolizes according to preset styles. The Map View fills with the working state. The Menu Bar and Toolbars appear along the top and the Status Bar appears at the bottom of the screen. See Figure 27 for a visual representation of the default layout. |

Follow the steps in Table 5 to properly save and close a project.
Table 5: Steps to Save and Close a Project
Step |
Action and Result |
Step 1 |
To save a project, use the Save button on the Standard toolbar. To ensure no work is lost, save after each major action or series of updates.
The Current edits window asks to save current changes for all layer(s).
Select Yes to save the changes or No to return to the map. Note: Participants may also use the Save option beneath the Project tab on the Menu bar to save the project. |
Step 2 |
To discard changes, close the application by selecting the red X in the upper right-hand corner of the main GUPS page. A Save? window prompts with a warning and options to either save, discard, or cancel.
Select Discard to close GUPS and discard changes. GUPS will not save the current project. |

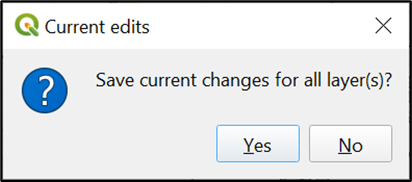
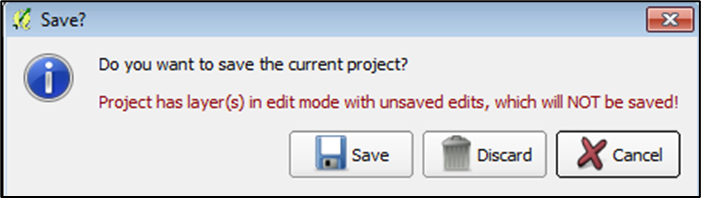
Table 6 details how to open a previously saved project.
Table 6: Steps to Open a Saved Project
Step |
Action and Result |
Step 1 |
To reopen a saved project, expand the menu beneath the Open Recent button in the Map Management window. The drop-down list provides a list of current projects created using GUPS to reopen.
|
Step 2 |
When a recent project file is chosen, the map for the project automatically loads and the layers appear in the Table of Contents. |
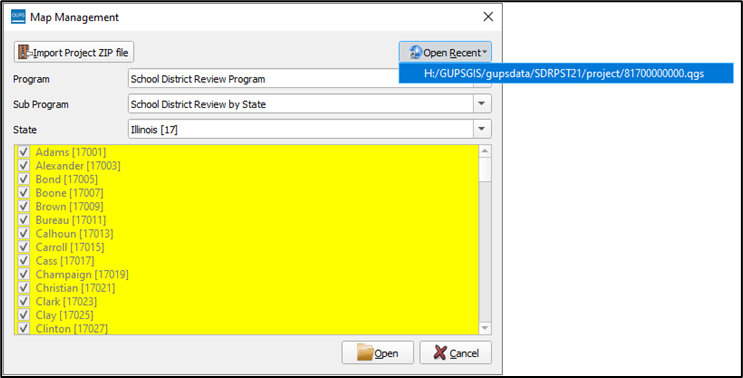
Figure 27 shows the layout of the main page for GUPS. This page contains all the tools needed for making updates in the SDRP. Shown in the figure are the main page elements.
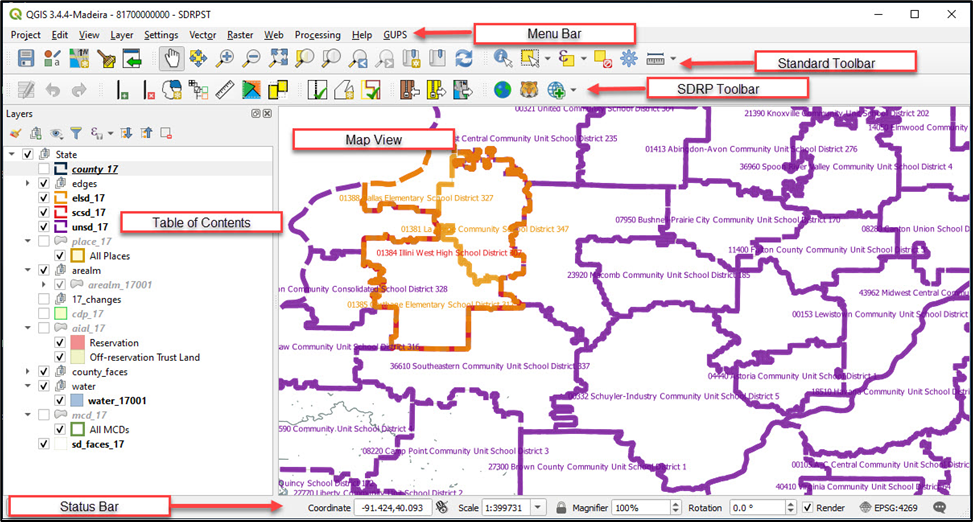
Figure 27: GUPS Main Page Elements and Default Layout
Refer to Table 7 for high-level information about the elements that comprise the main page once GUPS is opened. Detailed descriptions and functions of menus, sub-menus, and toolbars is in Appendix E.
Table 7: GUPS Main Page Elements and Their Function/Description
Page Element |
Function/Description |
Menu Bar |
Permits access to QGIS and GUPS features using a standard hierarchical menu. Offers basic features such as Settings and Help; tools to manage the Map View. Almost all functions available in Menu bar are available in toolbars. Refer to sub-appendix E1 for more details. |
Standard Toolbar |
Provides navigation functions and other tools needed to interact with the Map View and layers. Refer to sub-appendix E2 for more details. |
SDRP Toolbar |
Provides tools specific to the SDRP. See sub-section 5.2.1 below for descriptions of the buttons. |
Map View |
Displays the default data layers for the SDRP. Reflects the colors and symbology of layers in the Table of Contents. |
Table of Contents |
Depicts the layers in the Map View. Layers have been pre-styled and arranged for optimal use as part of the Census Web option. However, layers can be managed by manipulating the visibility (i.e., check/uncheck the layer) or reorganized using tools from the Table of Contents toolbar that appears at the top of the Table of Contents. Refer to sub-appendix E3 for more details. |
Status Bar |
Displays information on the coordinates, map scale, magnification, rotation, and projection. Allows for adjustment of the display. Refer to sub-appendix E4 for more details. |
The SDRP toolbar, shown in Figure 28, provides the program-specific functions needed to complete the SDRP review and update activities, as well as to import and export zipped shapefiles.
![]()
Each toolbar button function is described in Table 8.
Table 8: SDRP Toolbar Buttons and Their Function/Description
Button |
Name |
Function/Description |
|
Add Linear Feature |
Add a new linear feature to denote a new school district boundary. See sub-section 5.3.5 for an example of adding a linear feature. |
|
Delete Linear Feature |
Delete a linear feature. In SDRP GUPS, only user-added features are eligible for deletion. See sub-section 5.3.6 for examples of deleting a linear feature. |
|
Modify Area Feature |
Make updates to school districts (Boundary Change, Complex Consolidations, Complex Dissolutions and New District, etc.). See sub-section 5.2.2 for more information. |
|
Show/Hide Legend |
Shows or hides the legend (e.g., Table of Contents). It may be helpful to close the legend to make more screen space for the Map View. |
|
Scale Bar Tool |
Permits the selection of units of measure to display in the scale bar as well as the color of the scale bar to display in the Map View. |
|
Load/Unload County Reference Layer |
Permits loading and unloading of county-level reference layers into the SDRP project for any county within the state. This button permits loading of Census Bureau spatial layers for the selected county(s). Reference layers (e.g., roads, railroads, area landmarks, water, etc.) are required to be loaded before most school district updates may be made. When using Unload County Reference Layer, the data is removed from the project but not the computer. See sub-sections 5.3.2 and 5.3.3 for detailed instructions. |
|
Remove County Reference Layer |
Removes a loaded county reference layer from the project and deletes the data from the computer. Participants use this button when they determine they no longer need to reference the county level data. Once a county is removed, users would use the Load/Unload County Reference Layer button to load the county-reference layers back into the project. |
|
Geography Review Tool |
Review the attribute table for layers that exist in the Table of Contents. Refer to sub-section 5.4.2 for details. |
|
Review Change Polygons |
Review change polygons in a layer and make corrections. Refer to sub-section 5.4.3 for details. |
|
SDRP Criteria Review Tool |
Review potential criteria data errors and informational warnings. Refer to sub-section 5.4.1 for details. |
|
Import State Zip |
Imports another user’s “DataDirectory” output .zip file for review or editing by another person. GUPS generates this .zip file as part of the Export to Zip–Share with Another Participant option. This file is the whole state’s SDRP project and cannot be used if the same project is open in GUPS. This button will not work if the same project is open. As an alternative, use the Import Project Zip file button on the Map Management window prior to opening any project. |
|
Export to Zip |
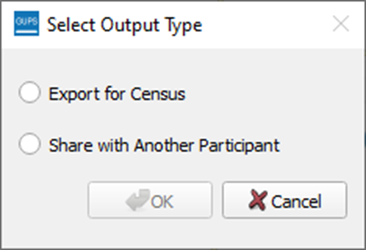
Includes two export options: Export for Census and Share with Another Participant. Refer to sub-section 5.5 for details on both options.
Use Export for Census option to create the .zip file of the SDRP project that contains all required data for submission to the Census Bureau. Use Share with Another Participant option to share work with others. |
|
Export Map to Print |
Export a printable map in .pdf, .png, .tif, or jpeg format. |
|
Internet Map Service |
Opens a GIS map service from the internet (i.e., Google Maps® or Bing Maps®) after selecting a point in the Map View. The intent of this tool is to provide visual assistance from an external source. An internet connection is required for this button to function. |
|
TIGERweb Map Service |
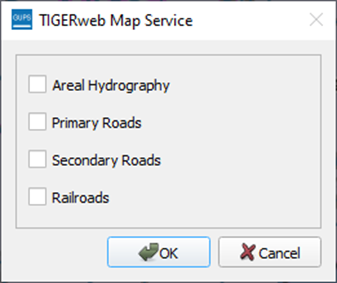
Permits loading of Census Bureau spatial data from the TIGERweb Web Map Service (WMS). The selected data layers load into the Table of Contents of the project. To remove the loaded layers, relaunch the button and uncheck the selected layers.
Because of the Load/Unload County Reference Layer button, users may not find this button necessary. |
|
Add Imagery/Remove Imagery |
Adds imagery to the SDRP project. The imagery loads near the bottom of the Table of Contents, so it underlies other layers. The button adds Esri imagery. Remove imagery by using the same button. It will change to include a red negative symbol, or users can remove imagery by using the mouse to right-click on the imagery layer in the Table of Contents. |
The Modify Area Feature tool (Figure 29) contains the functionality used to make most geographic and attribute updates during the SDRP. Once open, the Modify Area Feature tool becomes active upon selecting a Geography (a school district level including Elementary, Secondary, or Unified) and an Action (Boundary Change, Complex Consolidation, Complex Dissolution, or New District). The Modify Area Feature tool displays all school districts for the selected school district geography in the target layer list. The target layer list consists of the state, SDLEA code, and school district name located under the State and Info columns. School districts can be identified in the Map View from the info list in one of two ways:
A single left-click of the mouse on a school district highlights the district on the map but does not zoom to that school district.
A double left-click of the mouse both highlights and zooms to the full geographic extent of the selected school district in the Map View.
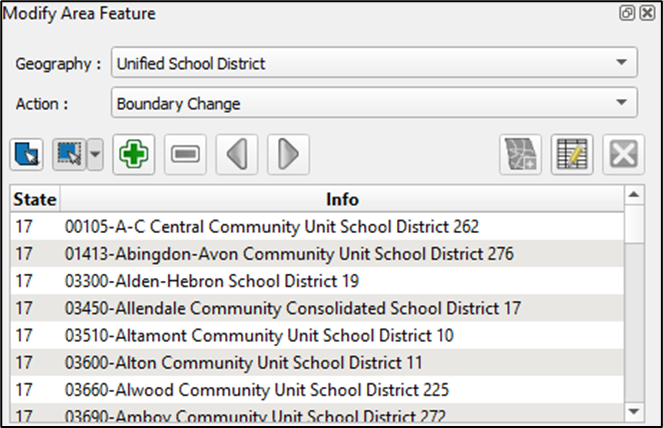
Figure 29: Modify Area Feature Tool
Table 9 describes each button in the Modify Area Feature tool and their function or description.
Table 9: Modify Area Feature Tool Buttons and Their Function/Description
Button |
Name |
Function/Description |
|
Select Target Layer |
Selects a target area (school district) by left-clicking the mouse on the map rather than selecting from the Modify Area Feature tool info list. |
|
Select Feature(s) |
Selects faces. This button allows the selection of individual faces and multiple faces by polygon, freehand, radius, and by geography. This button is vital to making corrections or updates, so review sub-section 5.2.2.1 for more details and examples of its use. |
|
Add Area |
Adds selected area to the chosen geography based on the desired action. |
|
Remove Area |
Removes selected area from the chosen geography. Note: This action is only available if completing a boundary change for secondary school district geography. |
|
Previous/Next Non-Contiguous Area |
Cycles through non-contiguous areas. |
|
Add New District |
Creates a new school district based on chosen geography. |
|
Change Attributes |
Opens editable attributes dialog window for selected target layer. |
|
Remove Area Feature |
This tool is disabled and not used during the SDRP. |
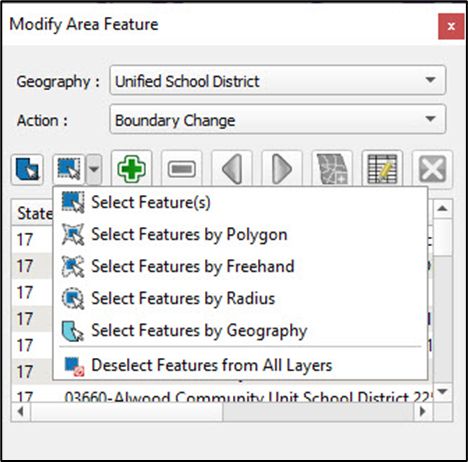
The Select Feature(s) button provides several methods to select faces to make changes to school districts. Table 10 describes each of the feature selection methods.
Table 10: Steps to Use the Select Feature(s) Button
Step |
Action and Result |
Step 1 |
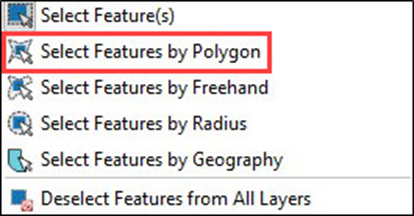
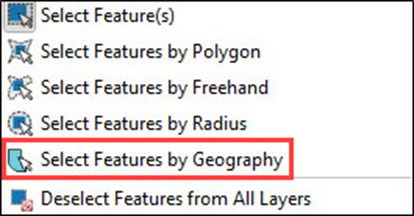
After selecting the geography, action, and target area in the Modify Area Feature window, use the Select Feature(s) button to highlight the school district faces to update. There are five feature selection methods: Select Feature(s), Select Features by Polygon, Select Features by Freehand, Select Features by Radius, and Select Features by Geography. In addition, there is an option to deselect the selection.
|
Step 2 |
To select faces or polygons one at a time, choose the Select Feature(s) option. Left-click the mouse on the face to update. The selected face turns yellow (color may vary).
|
Step 3 |
To select more than one face hold down the CTRL key on the keyboard while left-clicking the mouse on the additional face. This method is useful when selecting noncontiguous faces, as shown below.
|
|
To select multiple features, select the Select Feature(s) button, then drag the cursor over the features on the map. This method is useful when selecting a large number of contiguous faces. |
Step 4 |
The second option, Select Features by Polygon, selects features through a polygon drawn around the features on the map. To use this feature, select it in the drop-down menu then follow the steps below.
To use this option, left-click the mouse on the map to begin drawing the polygon. Drag the cursor to extend the line, left-click the mouse again to extend the line in a new direction. To complete the selection, right-click the mouse. Faces that either cross or are contained within the selection polygon will be highlighted in yellow. |
Step 5 |
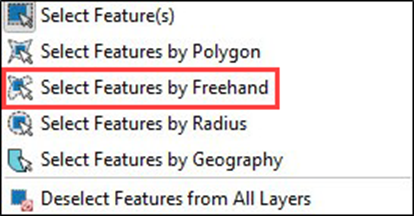
Select Features by Freehand selects features based on user-defined shapes drawn on the map.
To use this option, choose a spot on the map and use the cursor to draw any shape (polygon, triangle, circle, etc.). Features that either cross or are contained within the selection area will be highlighted in yellow. |
Step 6 |
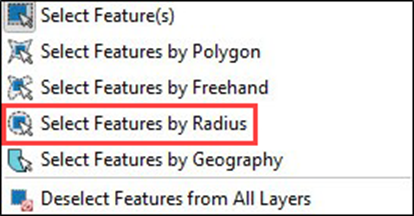
Select Features by Radius selects features by defining a circle around the features to select.
To use this tool, left-click the mouse on the map, then hold down the mouse and drag the cursor outward to expand the circle. Release the mouse when done. The feature(s) selected is (are) highlighted in yellow. |
Step 7 |
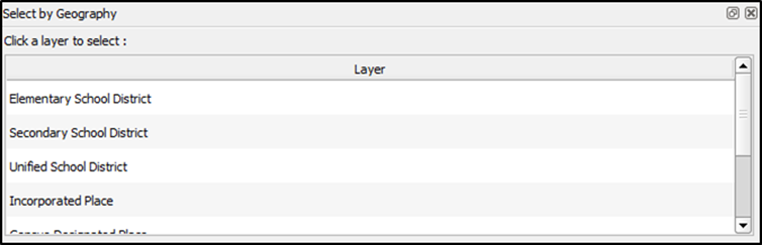
Select Features by Geography selects all the faces contained in a geographic entity. It is possible that changes to school districts will be made based on existing Census Bureau geography. For example, creating a new school district based on an incorporated place. For that example, instead of selecting each face, use of the Select by Geography tool will select all the faces of the chosen geography at once.
|
Step 8 |
After choosing Select Features by Geography, the Select by Geography layer window opens. This window can be docked in the project for ease of continued use.
Selecting a layer from the Select by Geography layer window activates the geography for that layer and limits the selection of features to that geography. In this example, all faces of an incorporated place are selected for a new elementary school district. |
Step 9 |
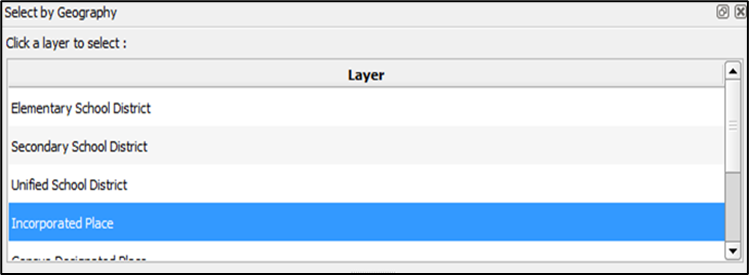
Select Incorporated Place from the Select by Geography layer window.
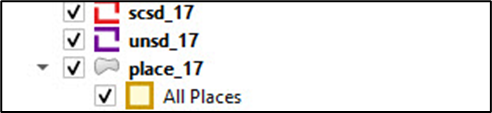
Ensure the visibility for the Incorporated Place layer is turned on in the Table of Contents.
|
Step 10 |
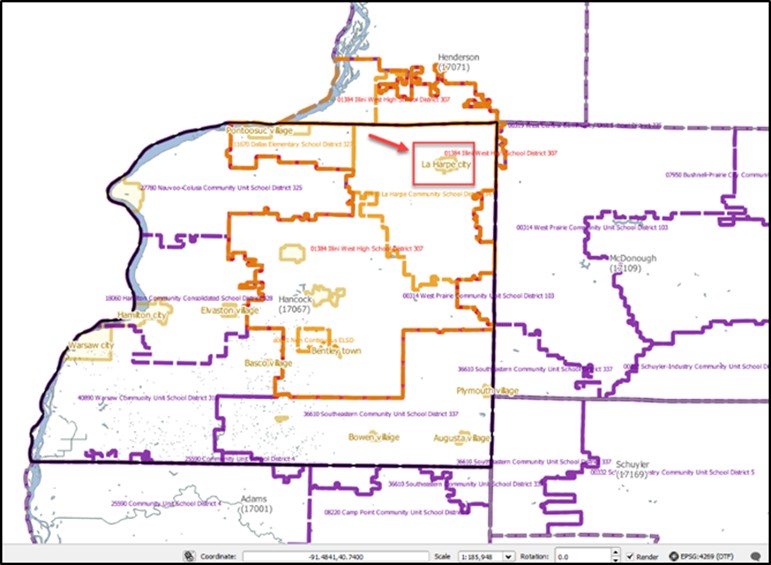
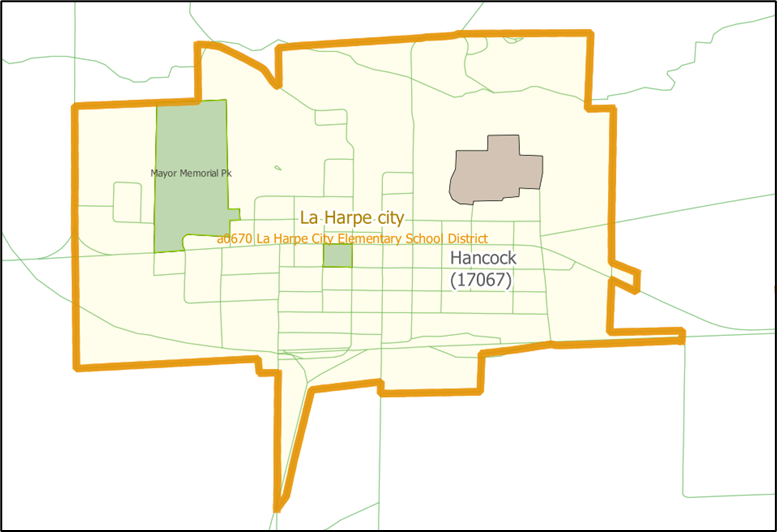
Zoom to La Harpe city.
|
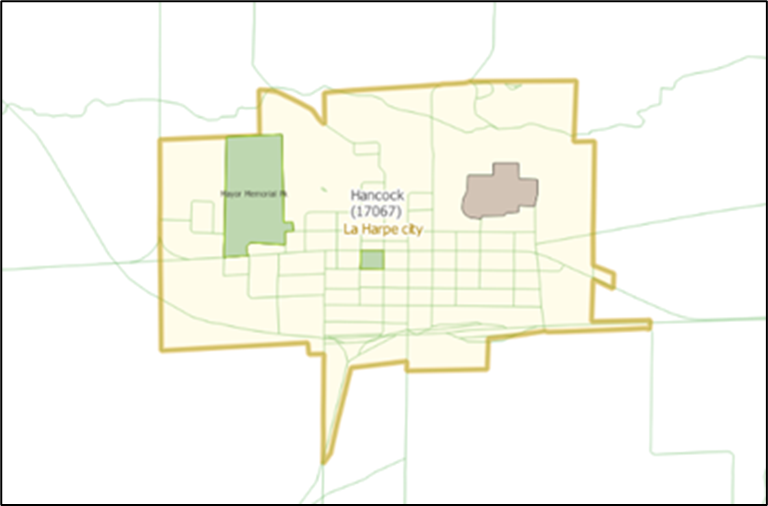
Step 11 |
With the Select by Geography tool active, left-click the mouse on any of the faces inside La Harpe city. The Select by Geography tool selects (highlights yellow) all faces. Note: There may be a lag between when the geography/faces are chosen and when GUPS completes the selection. This is common when selecting large geography/school district areas that contain many faces. If there is a noticeable lag, this generally indicates that GUPS is still processing the selecting faces.
|
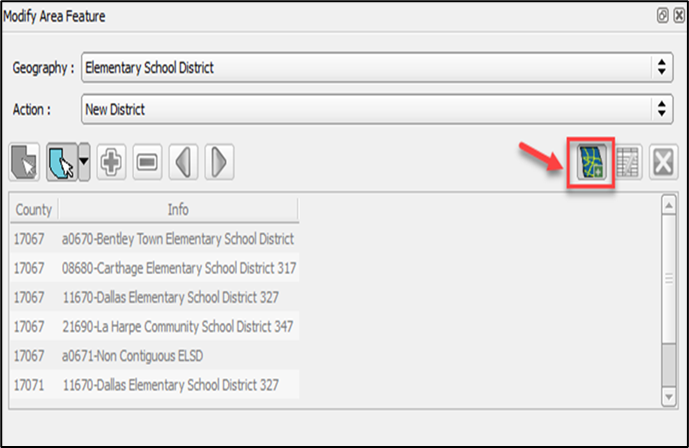
Step 12 |
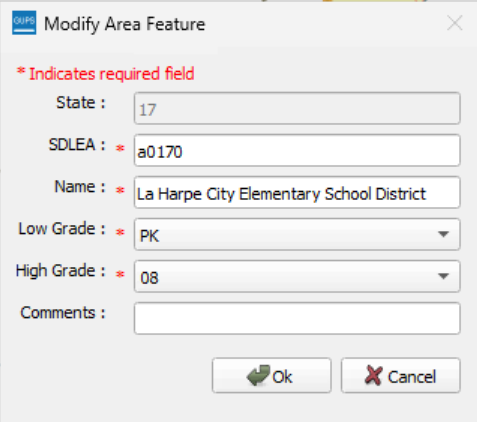
From the Modify Area Feature window, select the Add New District button.
Fill in attributes for the new school district and select Ok.
|
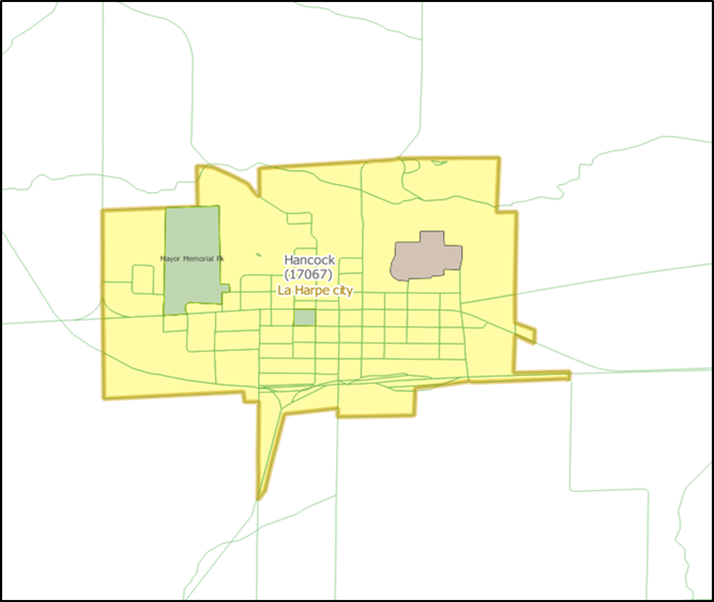
Step 13 |
All faces of the incorporated place of La Harpe city are now included in the La Harpe City Elementary School District.
|
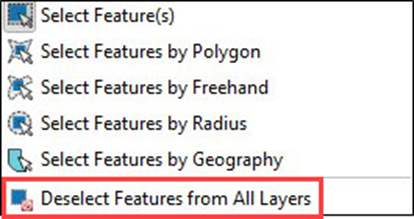
Step 14 |
Deselect Features from All Layers deselects all highlighted faces on the map.
|
The tables in this sub-chapter provide instructions for making SDRP updates using GUPS. The examples in this section begin with a new project for the state of Illinois. While the examples use real data, all changes are fictitious. They are for illustration only and do not indicate any actual geographic changes.
Boundary changes can include whole faces or split faces if the whole area of a selected face is not needed in the boundary change.
When making boundary changes using GUPS, keep the following in mind:
Load the county reference layers first.
Which school district is the target district (i.e., the one adding area), and if it is a(n) elementary, secondary, or unified school district?
Which school is losing area, and if it is a(n) elementary, secondary, or unified district?
Do faces need to be split to support boundary changes?
Follow the steps in Table 11 to load county reference layers to support new boundary changes.
Table 11: Steps to Load County Reference Layers
Step |
Action and Result |
Step 1 |
In the SDRP toolbar, select the Load/Unload County Reference Layer button.
|
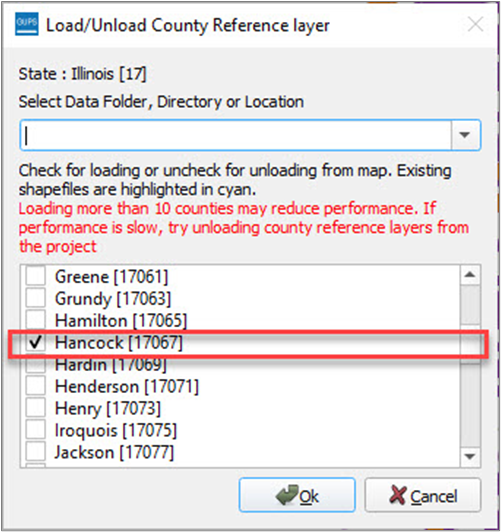
Step 2 |
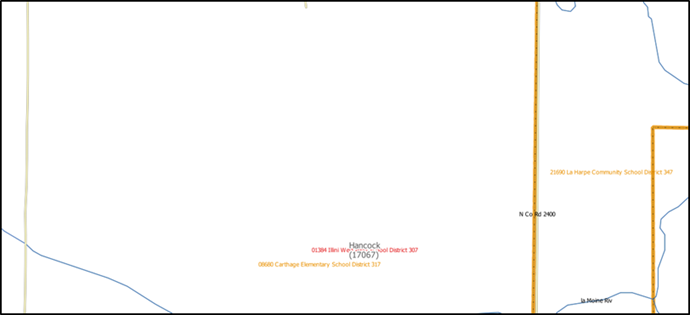
From the county list, select Hancock [17067] with a checkmark.
|
Step 3 |
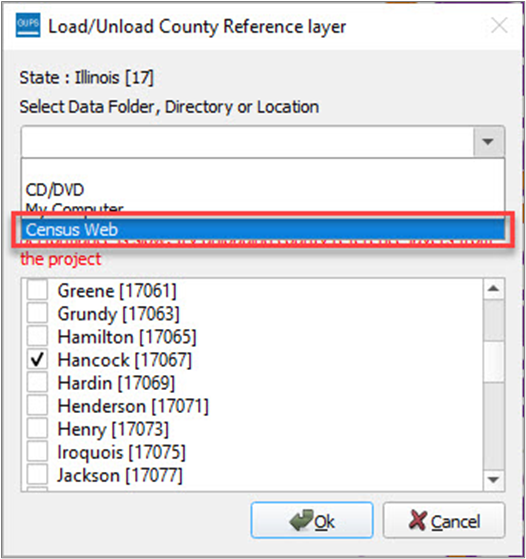
From the Select Data Folder, Directory or Location, select Census Web and then select Ok.
|
Step 4 |
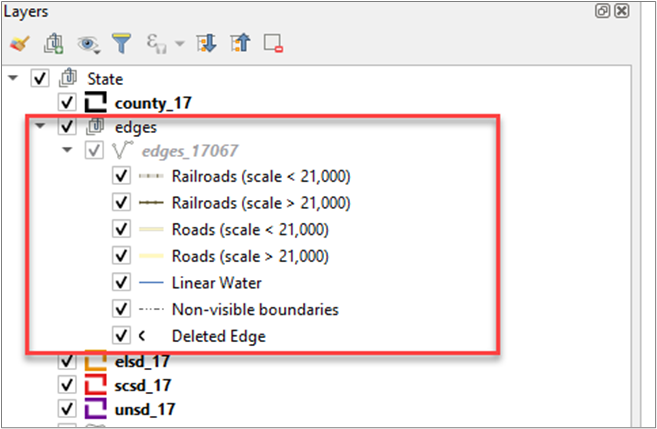
GUPS will begin to download the selected county. When the download completes, GUPS adds the country reference layers to the project. To confirm that county reference layers have been added, expand the edges group layer in the Table of Contents.
|
County reference layers in a project can be unloaded using the Unload County Reference Layers tool. This tool can be used if the number of loaded counties is starting to affect GUPS performance, or for counties that are no longer needed.
Note: Unloading county reference layers does not delete data from the computer. The county reference layer shapefiles still exist in the GUPSGIS home directory and can be reloaded, if needed.
Follow steps in Table 12 to unload county reference layers.
Table 12: Steps to Unload County Reference Layers
Step |
Action and Result |
Step 1 |
In the SDRP toolbar, select the Load/Unload County Reference Layer button.
|
Step 2 |
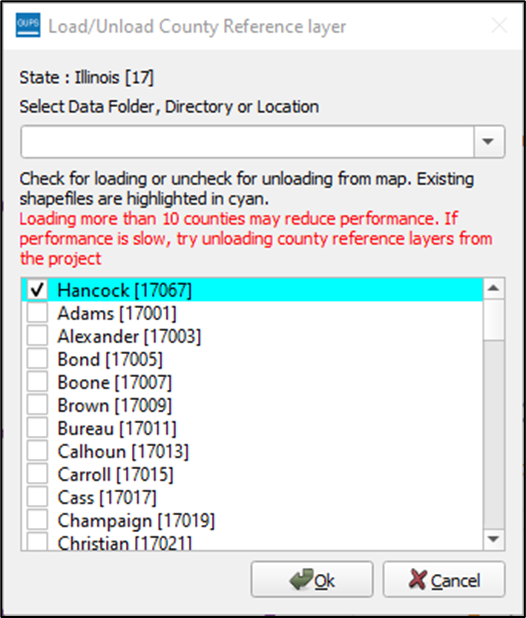
From the county list, loaded counties will appear first in the list and highlighted in cyan. To unload the county, uncheck the checkbox. Then select Ok.
|
Step 3 |
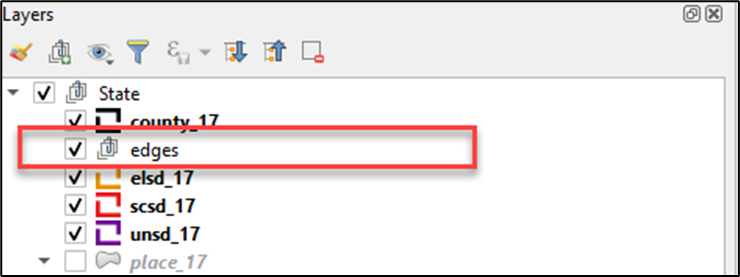
To confirm that the county reference layers have been unloaded, review the edges group layer in the Table of Contents. In this example, the edges group layer is no longer expandable confirming that the reference layers have been unloaded.
|
Follow the steps in Table 13 to add whole faces to an existing school district to complete a boundary change.
Table 13: Steps to Make a Boundary Change Using Whole Faces
Step |
Action and Result |
Step 1 |
Begin by selecting the Modify Area Feature button from the SDRP toolbar.
|
Step 2 |
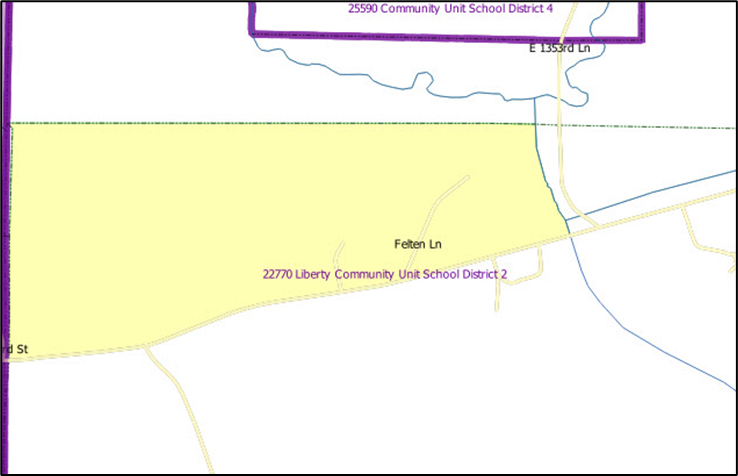
In this example, there is a boundary change between two elementary school districts, and the line that will be used as the new boundary already exists in the Census Bureau data. Whole faces from La Harpe Community School District are added to Carthage Elementary School District. In the Modify Area Feature window, use the mouse to select the drop-down arrow next to the Geography menu. In this example, choose Elementary School District. Select Boundary Change from the Action menu.
|
Step 3 |
When the Geography is chosen, the Modify Area Feature window populates with the list of available elementary school districts with the state and SDLEA code displayed for each district. The list is sorted alphabetically by school district name.
|
Step 4 |
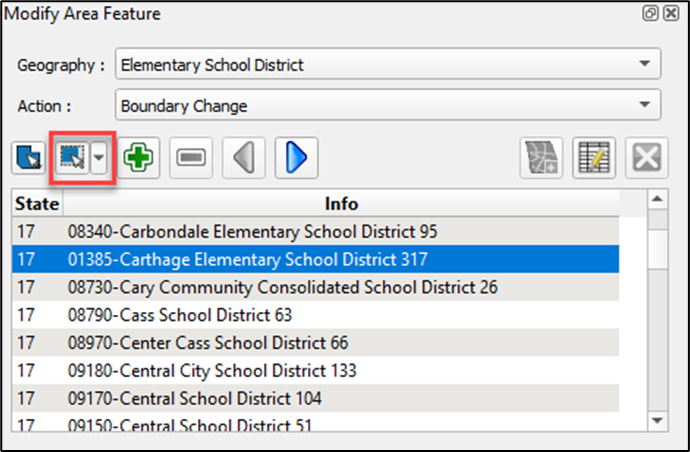
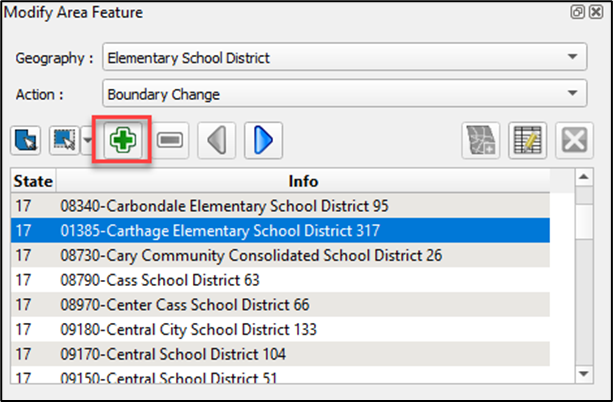
From the Modify Area Feature table list, select 01385–Carthage Elementary School District 317.
|
Step 5 |
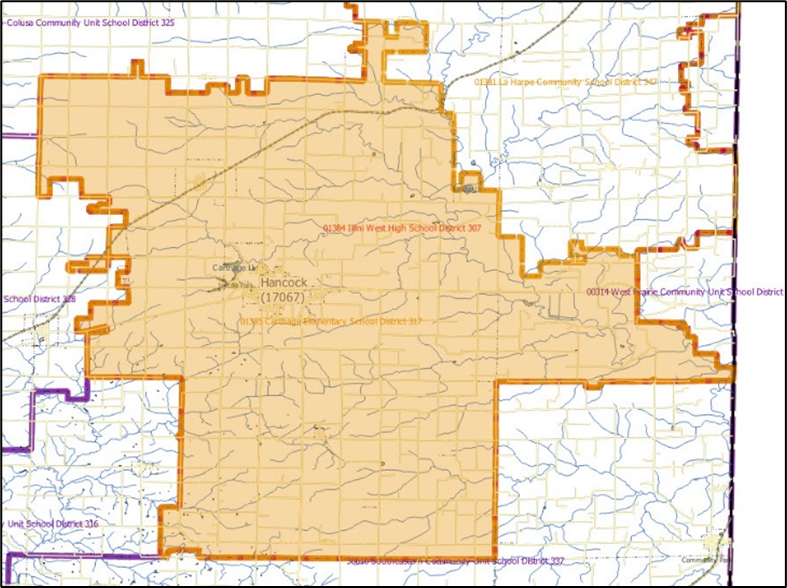
After the selection, the Modify Area Feature window highlights the school district in the Map View. A single left-click of the mouse highlights the school district. Double-clicking the left mouse button zooms to the extent of 01385–Carthage Elementary School District 317.
|
Step 6 |
Using the Zoom button in the Standard toolbar, zoom to the following area where the change will occur.
|
Step 7 |
From the Modify Area Feature window, select the Select Feature(s) button.
|
Step 8 |
On the map, left-click the mouse to select the following three faces from 01381–La Harpe Community School District 347. To select multiple faces, hold down the CTRL button on the keyboard while continuing to click the mouse. With each click of the mouse the face highlights in yellow to indicate an active selection.
|
Step 9 |
Click the Add Area button in the Modify Area Feature window to initiate the boundary change.
|
Step 10 |
As part of the boundary change process, the following notification appears listing the school districts(s) losing area as a result of the boundary change. Select OK.
|
Step 11 |
The next window provides an optional COMMENTS field that can be used to include any supporting information about the boundary change. Select Ok.
|
Step 12 |
The Map View updates to reflect the change in boundary made to Carthage Elementary School District.
|
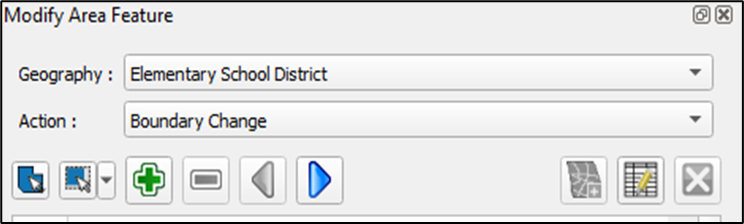
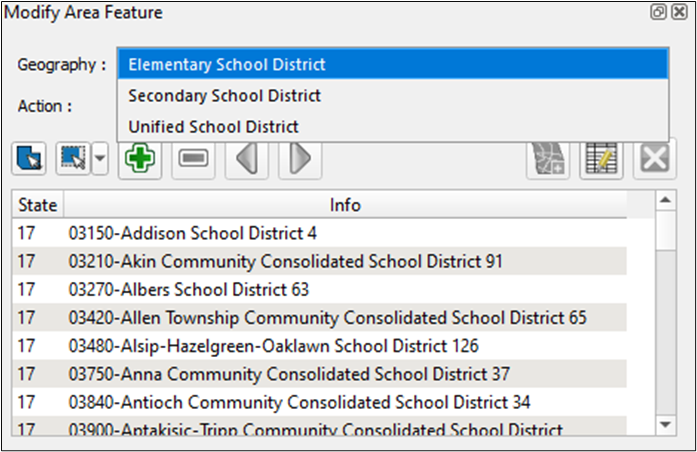
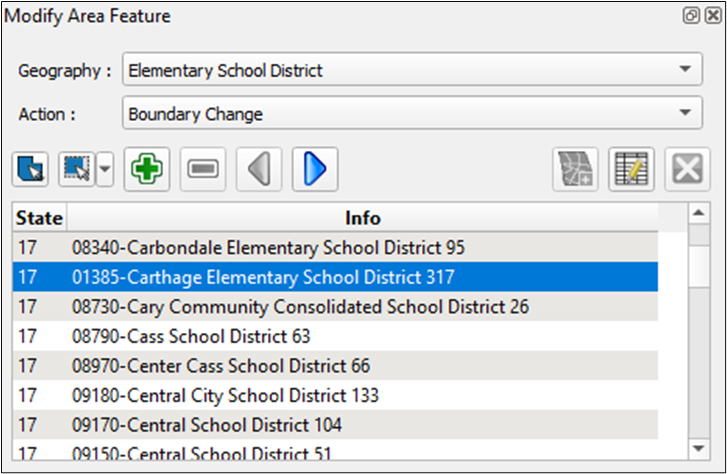
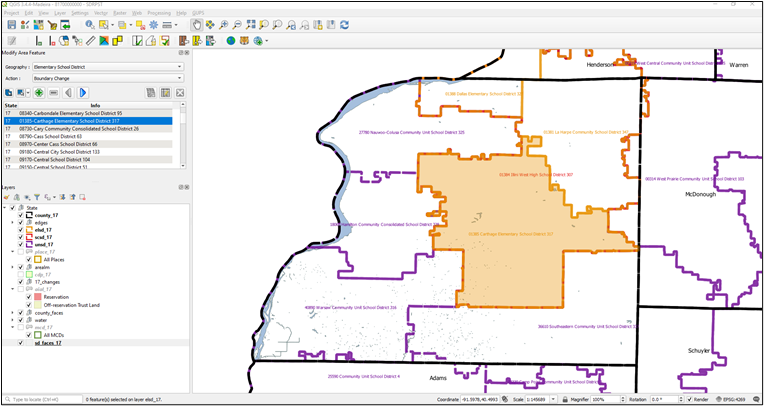
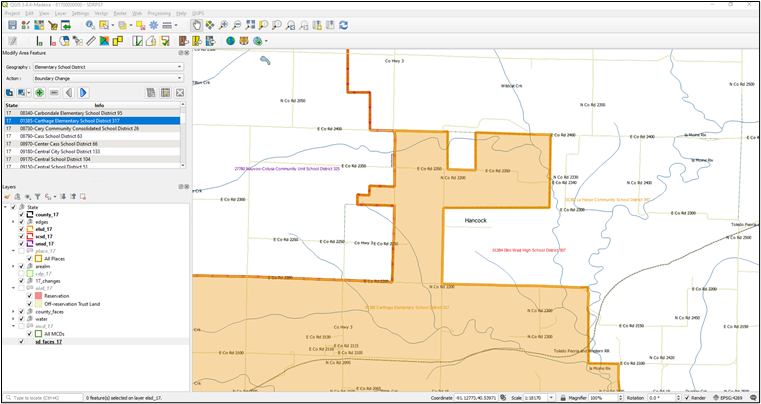
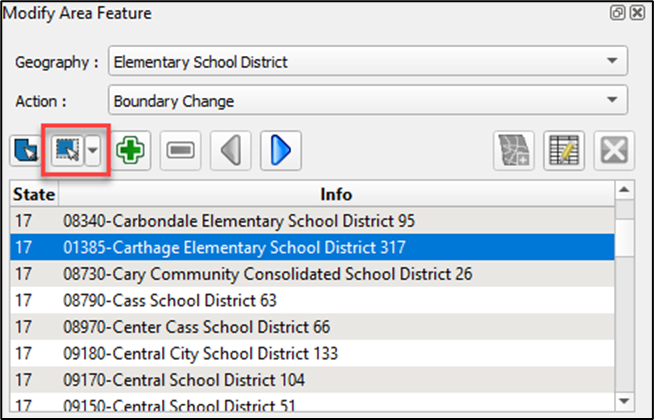
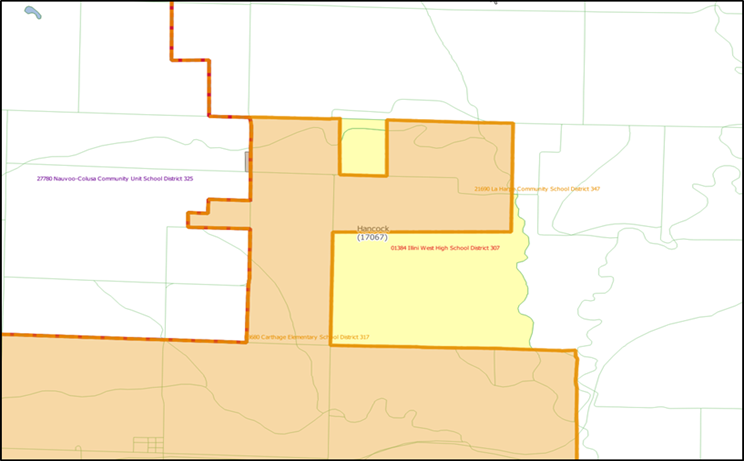
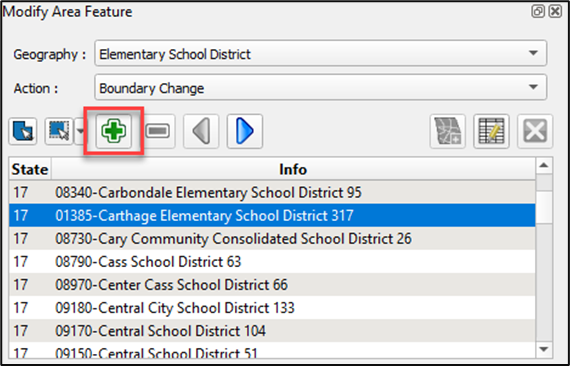
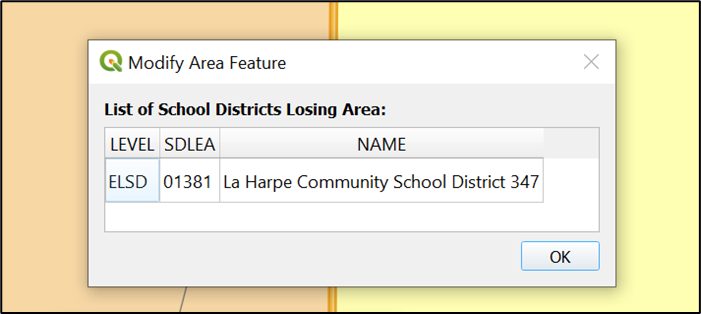
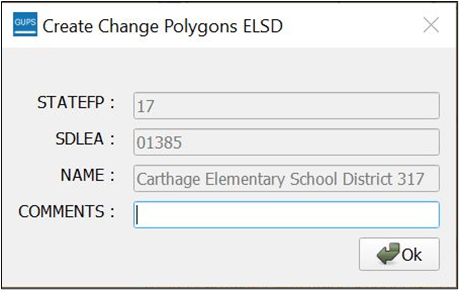
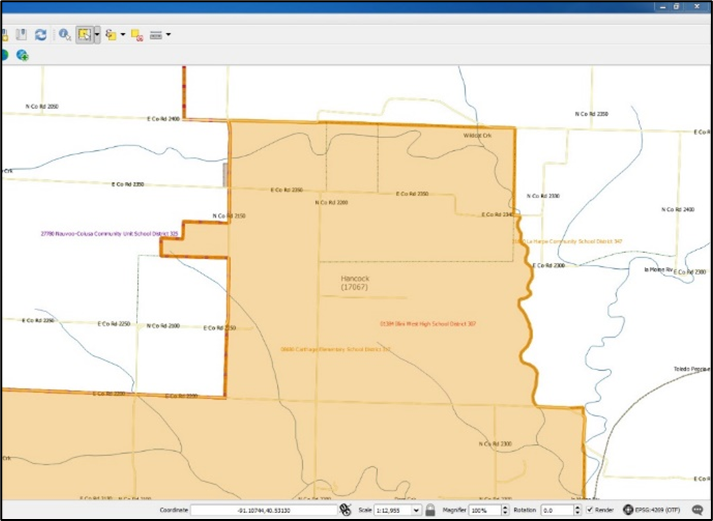
Table 14 describes the steps to add a linear feature to split a face if the whole area of a selected face is not to be included in the boundary change. After splitting the face, refer to Table 13 to complete the boundary change.
Table 14: Steps to Add a Linear Feature to Split a Face
Step |
Action and Result |
Step 1 |
From the SDRP toolbar, select the Add Linear Feature button.
|
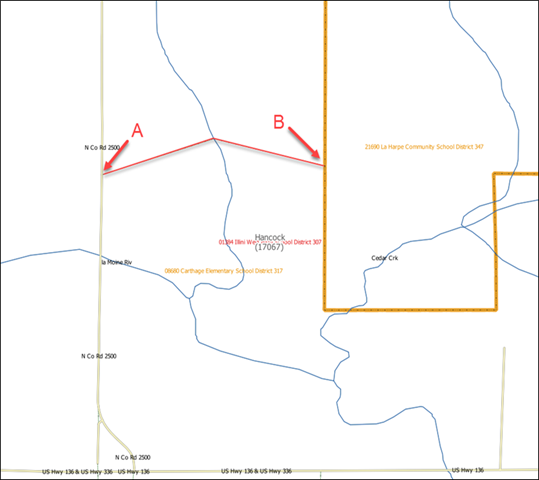
Step 2 |
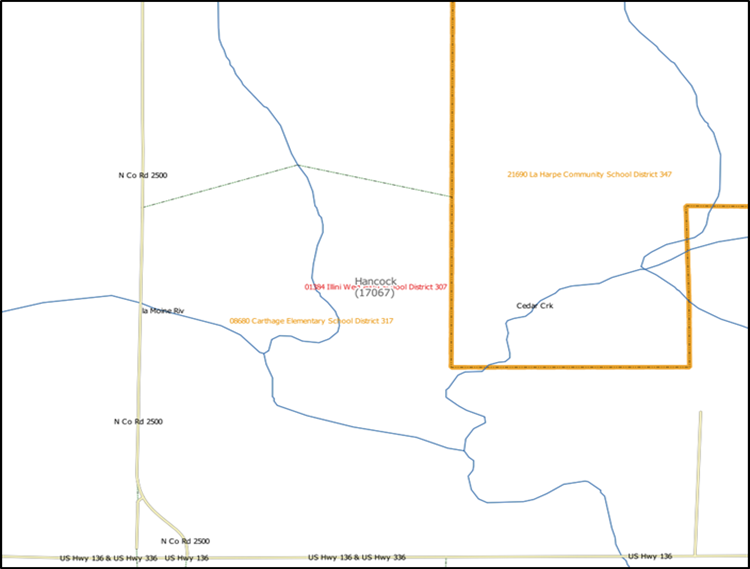
In this example, the new boundary does not exist in the Census Bureau data and a new linear feature must be added before the boundary change may be made. In the Map View, navigate and zoom to the area to split. Left-click the mouse at the starting point of the line (A) and continue to left-click the mouse at each vertex along the path of the line to be drawn. When the line is complete, right-click the mouse to finish drawing (B).
GUPS adds the linear feature to the map while also splitting faces. These split faces can be individually selected to include in a boundary change.
|
|
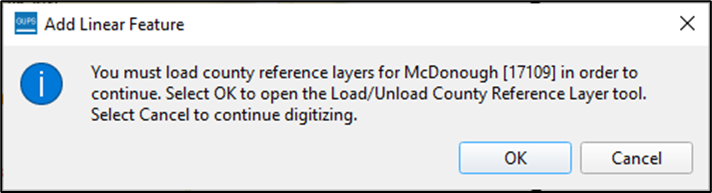
If a linear feature is added into an adjacent county that does not have county reference layers loaded, GUPS will display a message prompting that reference layers need to be loaded for the identified county to continue.
Select OK to automatically open the Load/Unload County Reference tool with the county preselected by GUPS to download. Select Cancel to close the window if adjacent county reference layers are not needed |

Linear features can be deleted one segment at a time, as described in Table 15, or multiple segments at a time as described in Table 16.
Table 15: Steps to Delete a Linear Feature One Segment at a Time
Step |
Action and Result |
|
Only user added linear features can be deleted using the Delete Linear Feature button. |
Step 1 |
In this example, a linear feature that was digitized incorrectly is deleted. Select the Delete Linear Feature button from the SDRP toolbar to delete the linear feature created in the previous steps.
|
Step 2 |
Left-click the mouse on the segment to delete. It will highlight in cyan to indicate its selection. When the Delete Linear Feature tool is active the mouse cursor turns into a cross-selection. Hover over the line segment to delete and left-click the mouse to complete the selection of the feature. A window opens to confirm whether to delete the selected feature(s).
Choose OK and GUPS deletes the line segment.
|
Step 3 |
Another method to delete a linear feature is by using the Select Feature(s) button and Select Features by Polygon option to draw a selection region/area over the line to delete then follow the same instructions as detailed in the previous step. |
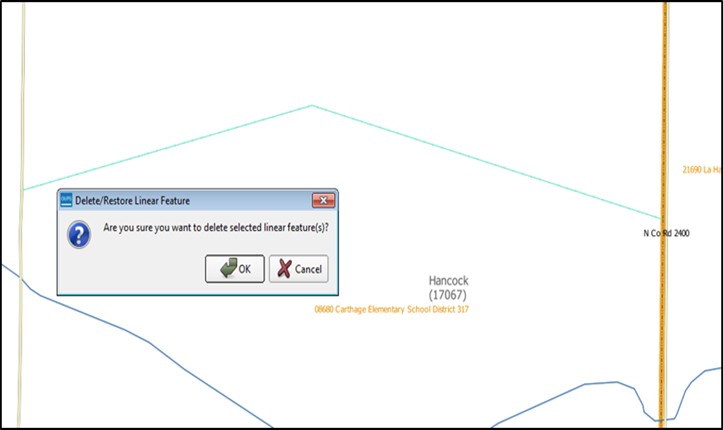

Table 16: Steps to Delete Multiple Segments of a Linear Feature
Step |
Action and Result |
Step 1 |
Choose the Select Feature(s) button from the Standard toolbar. Please note, the image below shows only a portion of the Standard toolbar.
Details on the Standard toolbar are found in sub-appendix E2. |
Step 2 |
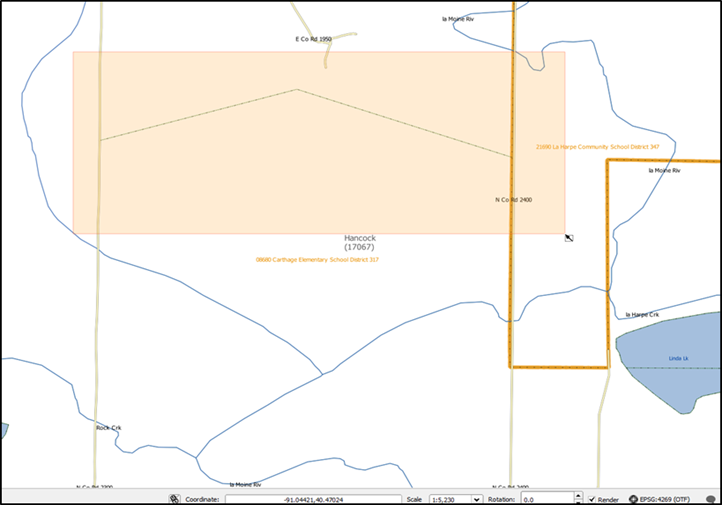
Left-click the mouse on the map and drag a selection box around the linear features added to the map. GUPS will highlight selected features yellow (color may vary).
|
Step 3 |
From the SDRP toolbar, with the linear feature selected, select the Delete Linear Feature button.
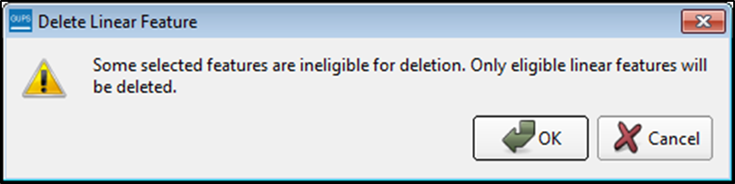
Only user added linear features are eligible for deletion. GUPS will notify if any of the selected features are ineligible for deletion. Select OK to proceed with deletion or Cancel to close the window and cancel the deletion request.
|
Step 4 |
The Map View refreshes, and the linear feature is deleted.
|
If GUPS detects that an elementary school district boundary change may require a corresponding secondary school district boundary change, GUPS will offer the user the option to proceed with the secondary boundary change once the elementary change is complete. The user may choose to use the same face selection from the elementary school district boundary change to update the secondary school district, or the user can decline if the secondary update is not appropriate. Follow the steps in Table 17 to complete this action.
Table 17: Steps to Make Elementary and Secondary School District Boundary Changes
Step |
Action and Result |
Step 1 |
Begin by selecting the Modify Area Feature button from the SDRP toolbar.
|
Step 2 |
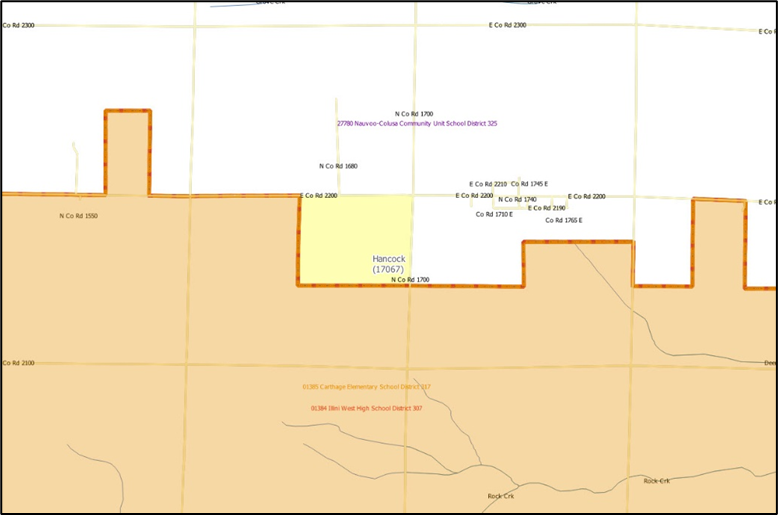
In this example, a boundary change will be completed between 01385–Carthage Elementary School District 317, 01384–Illini West High School District 307, and 27780–Nauvoo-Colusa Community Unit School District 325. In the Modify Area Feature window, select Elementary School District from the Geography drop down menu and then choose Boundary Change from the Action drop down menu.
|
Step 3 |
Double-click the left mouse button to select 01385–Carthage Elementary School District 317 from the target layer list.
Upon selection, the Map View zooms to the extent of 01385–Carthage Elementary School District 317.
|
Step 4 |
Choose the Select Feature(s) button from the Modify Area Feature window.
|
Step 5 |
From the Map View, select any face from the adjacent 27780–Nauvoo-Colusa Community Unit School District 325 using the Select Feature(s) button. The selected face will highlight in yellow.
|
Step 6 |
From the Modify Area Feature window, select the Add Area button to begin the boundary change.
|
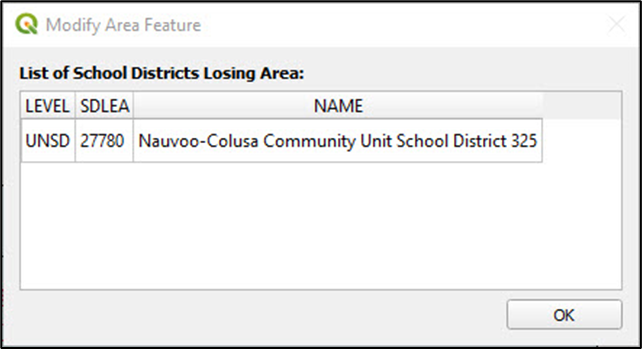
Step 7 |
GUPS begins to process the boundary change. The List of School Districts Losing Area window appears. Select OK to dismiss the window.
|
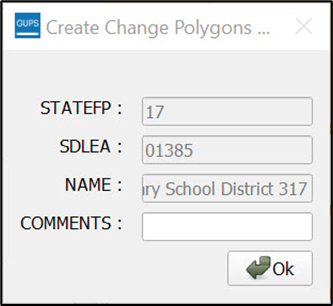
Step 8 |
The following window provides read-only attribute information for the target elementary school district. The COMMENTS field is optional. Select Ok continue.
|
Step 9 |
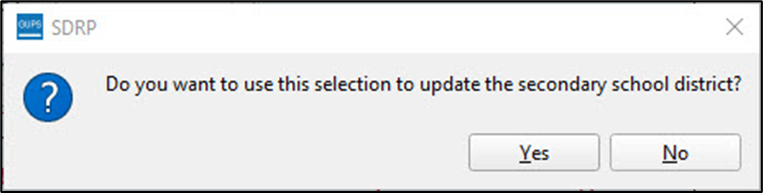
GUPS opens a new dialog window that asks, “Do you want to use this selection to update the Secondary School District?” If No is selected, the update completes, leaving the elementary school district boundary change intact and making no change to the secondary school district. To update the secondary school district, select Yes.
|
Step 10 |
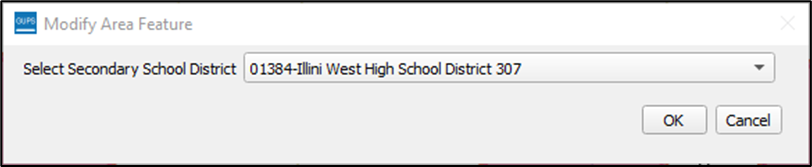
GUPS opens a new dialog window with the prompt “Select Secondary School District.” This drop-down menu provides a list of all Secondary School Districts in the state, sorted by Secondary School District name. Choose 01384–Illini West High School District 307 then select OK.
|
Step 11 |
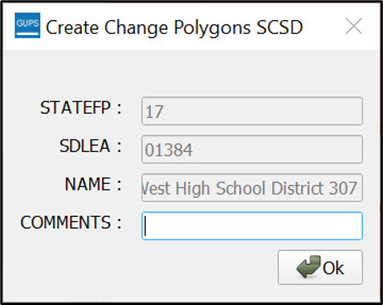
GUPS begins to process the boundary change. The following window opens, providing non-editable and editable attribute information of the target secondary school district. The COMMENTS field is optional. Select Ok to continue.
|
Step 12 |
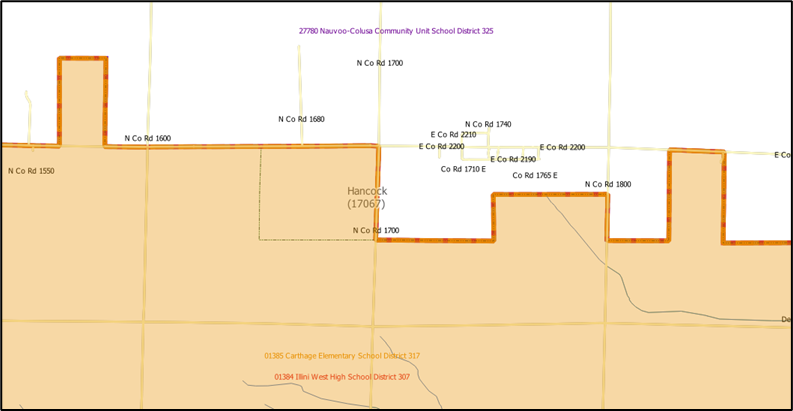
GUPS refreshes the Map View, and the secondary school district boundary change is complete.
|

A complex consolidation change refers to the situation where two or more school districts merge to create a new school district with a new name and new SDLEA code along with additional boundary changes. Follow the steps in Table 18 to perform a complex consolidation.
Table 18: Steps to Perform a Complex Consolidation
Step |
Action and Result |
Step 1 |
Begin by selecting the Modify Area Feature button from the SDRP toolbar.
|
Step 2 |
In this example, a complex consolidation will be completed between 01388–Dallas Elementary School District 327 and 01381–La Harpe Community School District 347. In the Modify Area Feature window select Elementary School District from the Geography drop down menu and then choose Complex Consolidation from the Action drop down menu.
|
Step 3 |
Double-click the left mouse button to select 01388–Dallas Elementary School District 327 from the target layer list. Upon selection, the Map View zooms to the extent of Dallas Elementary School District.
|
Step 4 |
To begin the consolidation, choose the Select Feature(s) button from the Modify Area Feature window.
|
Step 5 |
Using the Select Feature(s) button, select any face from 01381–La Harpe Community School District 347. This selection is for identifying the second school district to be included in the complex consolidation. When a face is selected, the Complex Consolidation Selection dialog opens with a list of all unified and elementary school districts in the state. This warning window confirms the school districts to consolidate from. Select OK.
|
Step 6 |
The Map View refreshes and the entire La Harpe Community School District is highlighted in yellow.
|
Step 7 |
With both school districts selected, choose the Complex Consolidation button from the Modify Area Feature window to begin the consolidation.
|
Step 8 |
The first window to appear is for Selected School Districts. This window includes a layer list of school districts to be consolidated as well as two radio buttons to choose the school district type to consolidate into.
The radio button automatically defaults to the school district type of the selected target layer, in this case, Elementary School District. It is also possible to consolidate the chosen elementary school districts into a unified school district by selecting the Unified School District radio button. In this example, the chosen elementary school districts are consolidated into a new elementary school district. Select OK. |
Step 9 |
The Modify Area Feature Attribute window opens. This window is used to provide the attribute information for the new consolidated school district. Required fields include SDLEA, Name, Low Grade, and High Grade. Comments are optional.
|
Step 10 |
GUPS automatically generates a temporary SDLEA code. If an approved SDLEA code exists, enter it into the SDLEA field. If a temporary number is used, the SDRP team will obtain a permanent SDLEA code from the NCES. In this example, the automatically generated SDLEA code is used. Fill in the remaining required fields as shown below. Select Ok to close the window.
|
Step 11 |
The Map View refreshes, and the newly consolidated Dallas La Harpe Elementary School District appears on the map.
|
Step 12 |
A complex consolidation must also include boundary change(s). The next step is to complete these boundary changes. Refer to sub-section 5.3.1 for directions on how to perform a boundary change. |
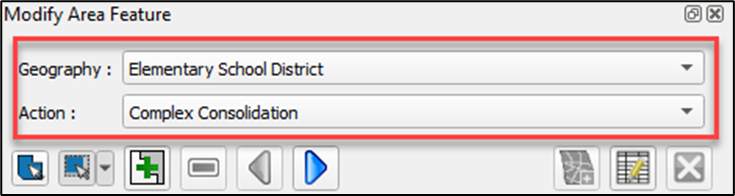
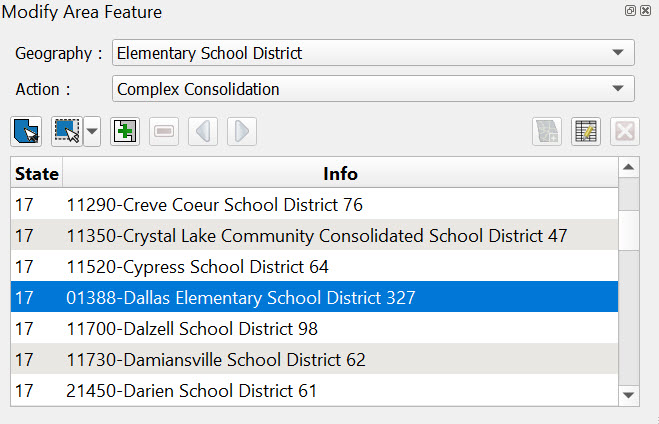
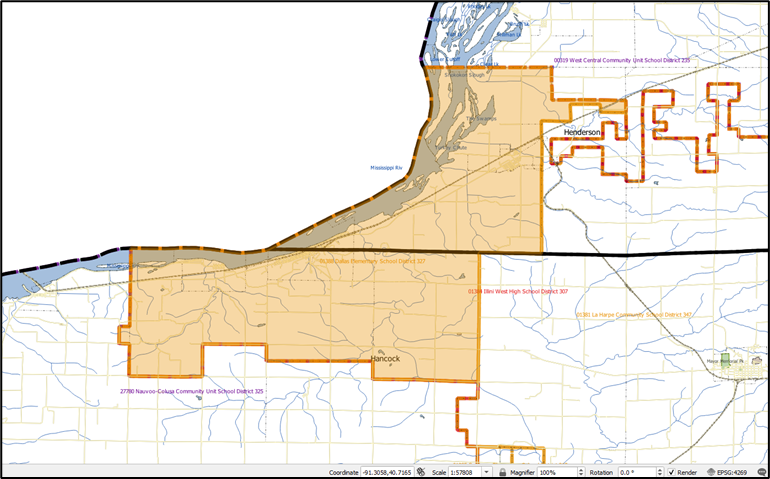
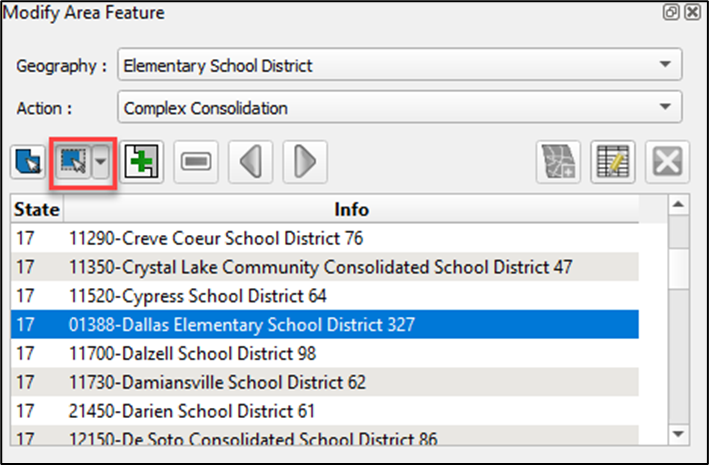
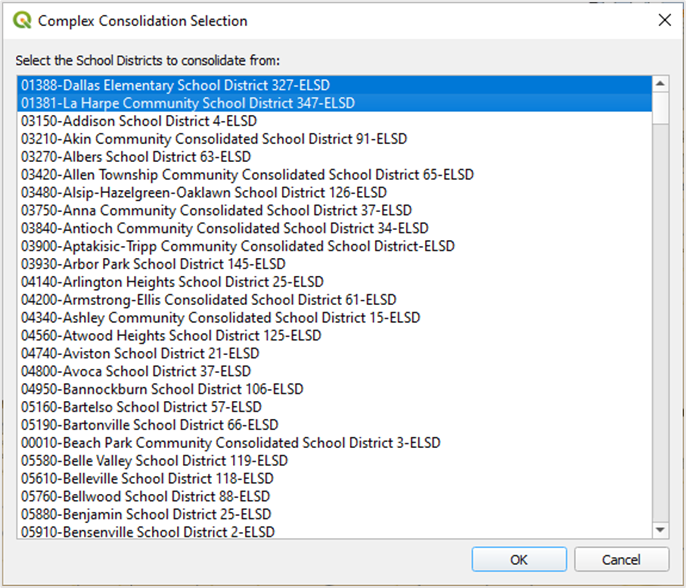
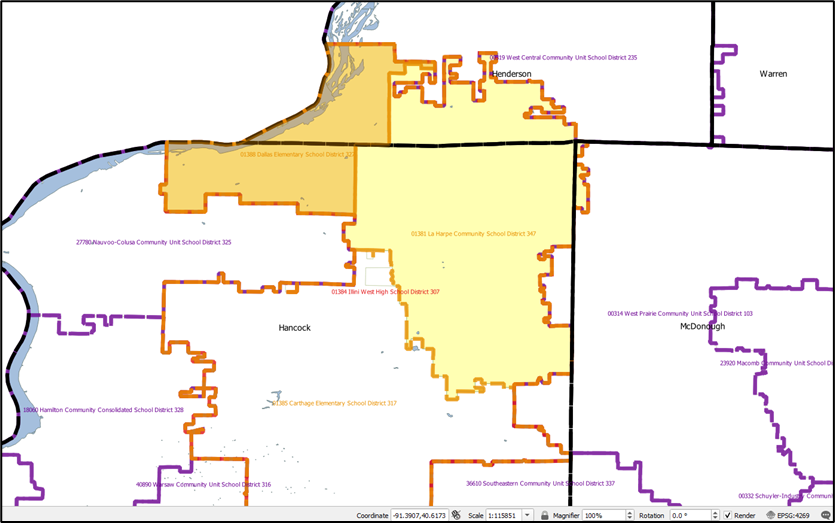
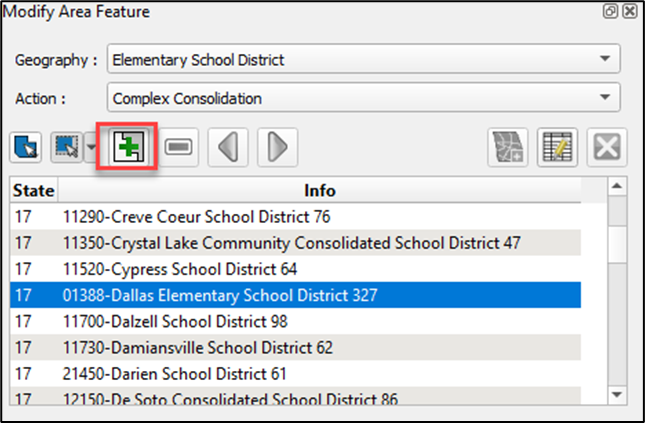
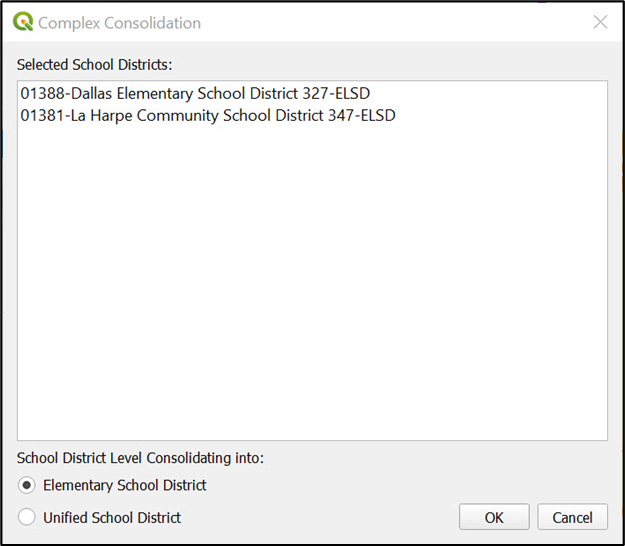
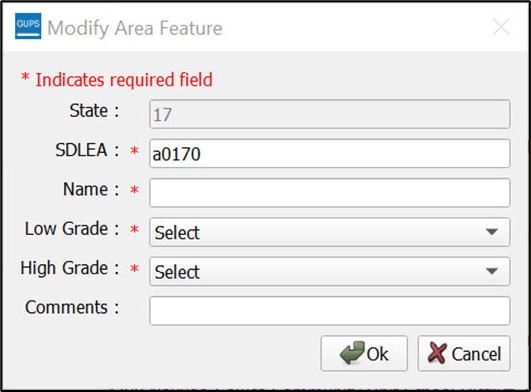

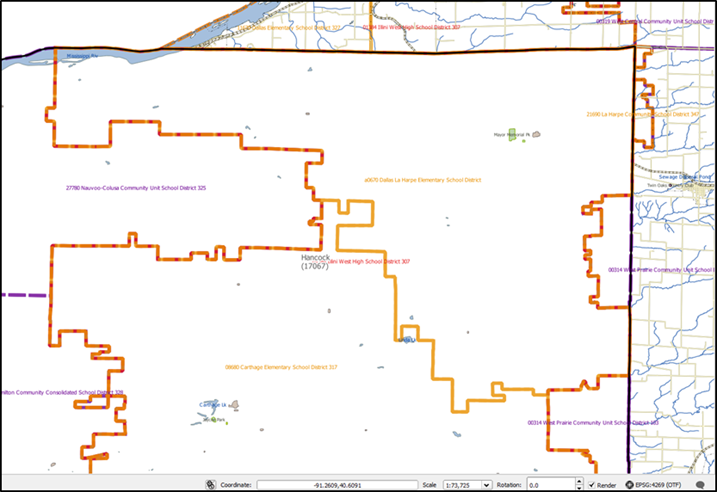
A complex dissolution change occurs when a single school district is dissolved and its area split between two or more other existing school districts, with or without additional boundary changes. Follow the steps in Table 19 to perform a complex dissolution.
Table 19: Steps to Perform a Complex Dissolution
Step |
Action and Result |
|
Complex dissolutions require county reference layers to be loaded into the SDRP project. For the affected school districts, confirm that county reference layers have been loaded for all applicable counties. Use the Load/Unload County Reference Layer tool described in Table 11 to load county reference layers. |
Step 1 |
Begin by selecting the Modify Area Feature button from the SDRP toolbar.
|
Step 2 |
In this example, a
complex dissolution is completed using a unified school
district,
|
Step 3 |
Select 18060–Hamilton Community Consolidated School District 328 from the target layer list.
|
Step 4 |
Upon selection, the Map View zooms to the extent of Hamilton Community Consolidated School District.
|
Step 5 |
To begin the dissolution, choose the Select Feature(s) button from the Modify Area Feature window.
|
Step 6 |
Use the Select Feature(s) button to choose faces from the target layer. This may be done by either 1) selecting individual faces to be included or 2) selecting a region of faces by left-clicking the mouse and dragging across the target school district. Only faces that exist within the target school district will be selected. Selected faces will be highlighted in yellow. This example overlays the yellow on the purple for the school district.
|
Step 7 |
With the faces selected, choose the Complex Dissolution button from the Modify Area Feature window to begin the dissolution.
|
Step 8 |
The first window to appear is for Select School Districts. Each school district listed is sorted alphabetically by level. From this list, choose the school district that will be used to incorporate the dissolved faces. In this example, select 27780–Nauvoo-Colusa Community Unit School District 325, then select OK.
|
Step 9 |
The final window to appear is the Create Change Polygons attribute information. The COMMENTS field is editable to allow any notes that may be relevant to the dissolution. Select Ok.
|
|
There could be a lag between selecting the faces to be included in the dissolution and when the dissolution completes in GUPS. If there is a noticeable lag, GUPS is still in the process of dissolving the selected faces and completes once the Modify Area Feature notification appears. |
Step 10 |
The Map View refreshes and the updated school district boundaries for both Hamilton Community Consolidated School Districts and Nauvoo-Colusa Community Unit School District display.
|
Step 11 |
GUPS automatically reselects 18060–Hamilton Community School District 328 to finish selecting the remaining faces.
|
Step 12 |
To complete the dissolution, select the remaining faces and dissolve them into neighboring Warsaw Community Unit School District. Once dissolved, the revised school district boundaries should reflect the example below. To help view the dissolution, a red rectangle is used in the image below. The former boundary lines are shaded in light gray.
|
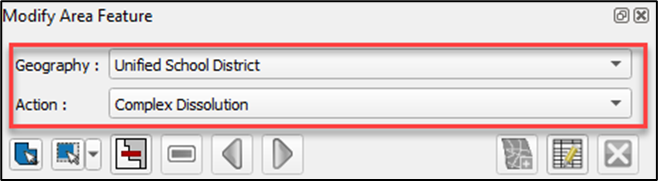
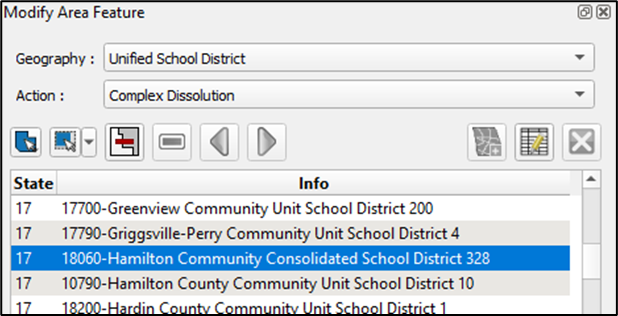
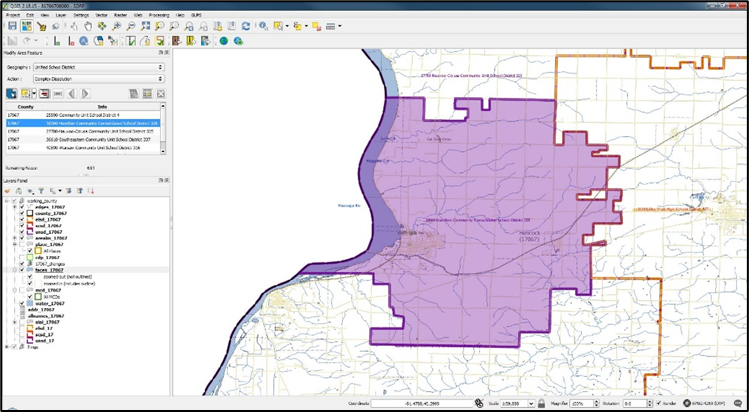
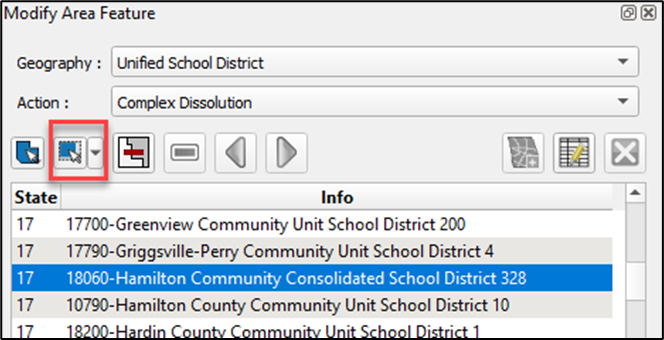
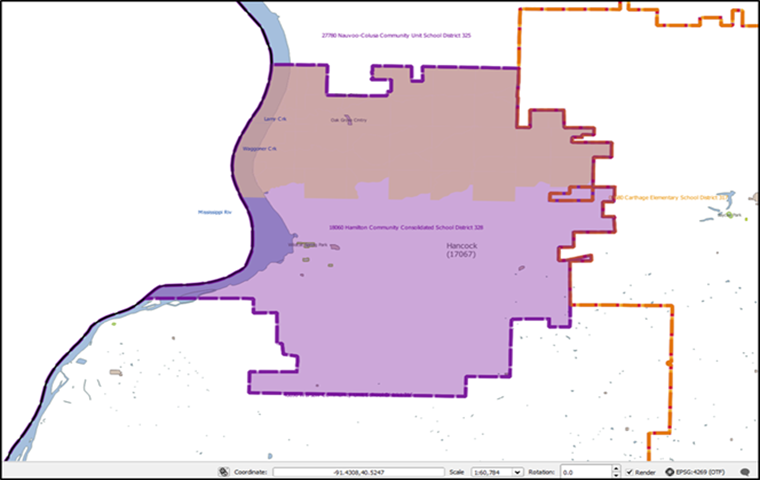
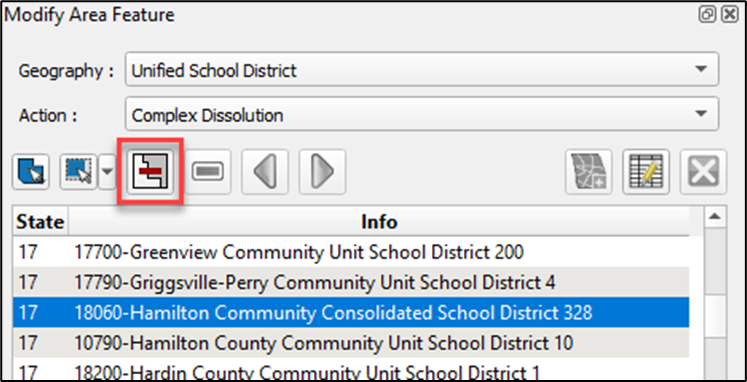
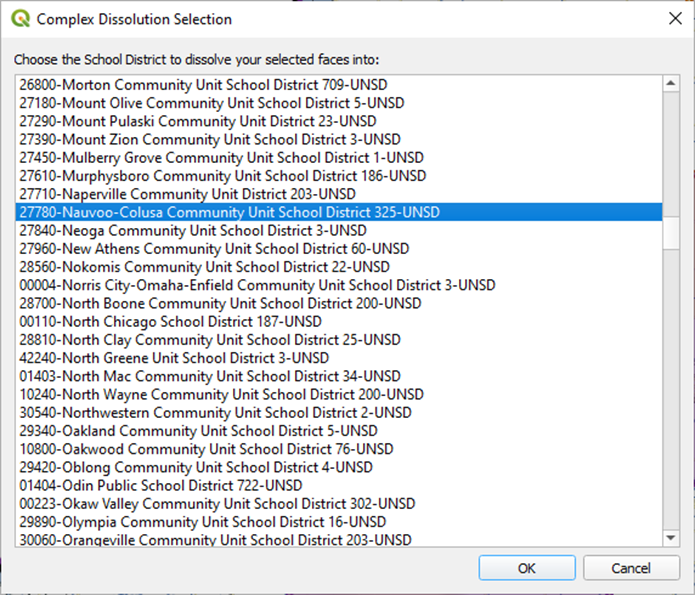
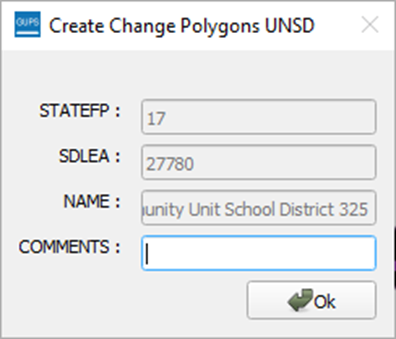
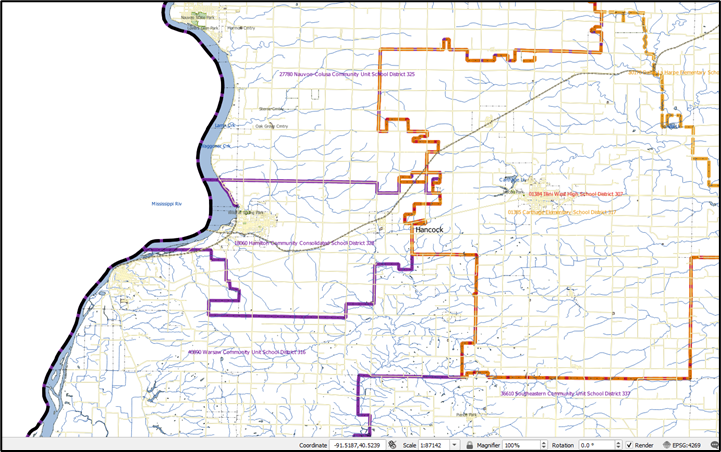

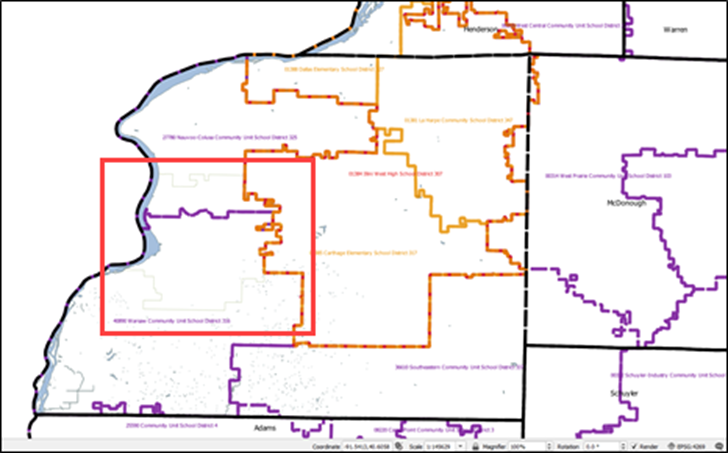
A new district change occurs when transferring area from one or more existing school districts to form a completely new school district. Do not confuse this transaction with a consolidation where the entire area of one or more school districts consolidates to form a new school district. Follow the steps in Table 20 to create a new school district.
Table 20: Steps to Create a New District
Step |
Action and Result |
|
A new district change requires county reference layers to be loaded. Confirm that county reference layers have been loaded for all applicable counties before continuing. Use the Load/Unload County Reference Layer tool described in Table 11 to load county reference layers. |
Step 1 |
Begin by selecting the Modify Area Feature button from the SDRP toolbar.
|
Step 2 |
This example illustrates creating a unified school district, Hancock Unified School District. In the Modify Area Feature window, use the mouse next to the Geography and Action drop-down menus to choose Unified School District. Select New District, respectively.
Note: When the action is set to New District, the Modify Area Feature window disables the school district layers list and activates only the Select Feature(s) and New District buttons. |
Step 3 |
From the Modify Area Feature window, choose the Select Feature(s) button.
|
Step 4 |
In the Map View, zoom into an area to include in the new district. This example demonstrates selecting faces from existing 40890–Warsaw Community Unit School District 316 to create the new district.
|
Step 5 |
Select the Add New District button in the Modify Area Feature window.
|
Step 6 |
The Modify Area Feature window opens with attributes needed to create a new district.
The red asterisk denotes the required fields (SDLEA, Name, Low Grade, and High Grade) to complete the new district fields. GUPS automatically generates a temporary SDLEA code. If a temporary number is used, the SDRP team will obtain a permanent SDLEA code from the NCES. Complete these fields and then select Ok. |
Step 7 |
The List of School Districts Losing Area window appears. Select OK.
|
|
There could be a lag between selecting the faces to be included in the new district and when the new district action completes in GUPS. If there is a noticeable lag, GUPS is still in the process of creating the new district with the chosen faces and completes once the Modify Area Feature notification appears. |
Step 8 |
The Map View refreshes, and the new Hancock Unified School District appears on the map.
|
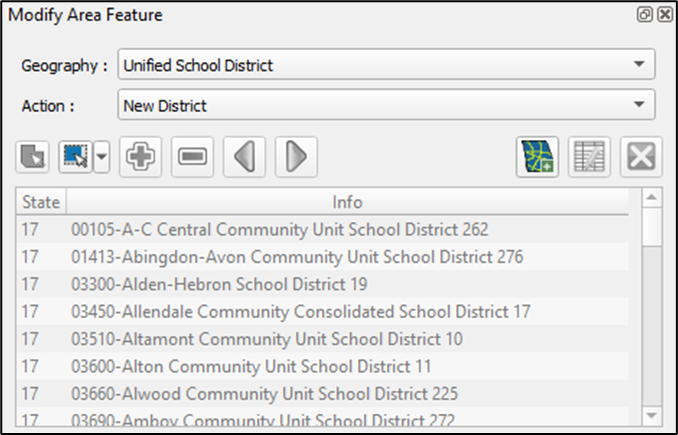
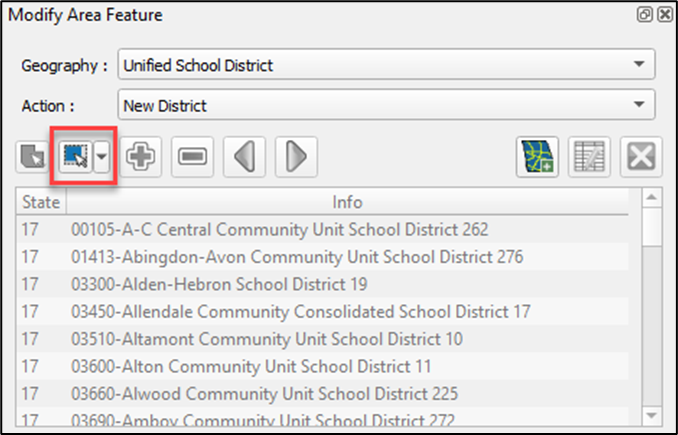
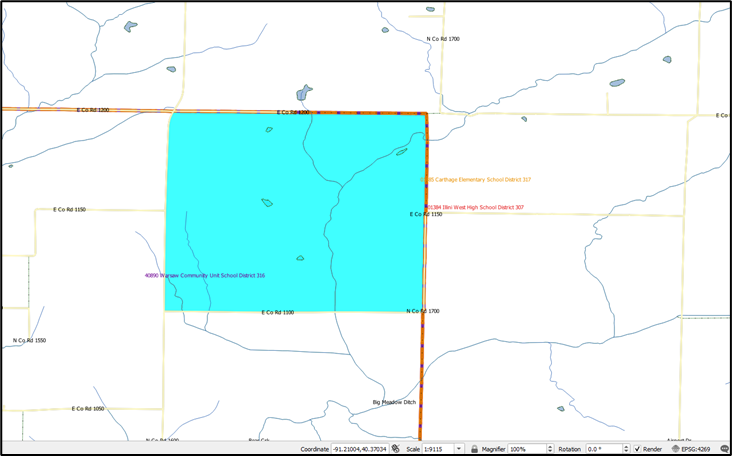
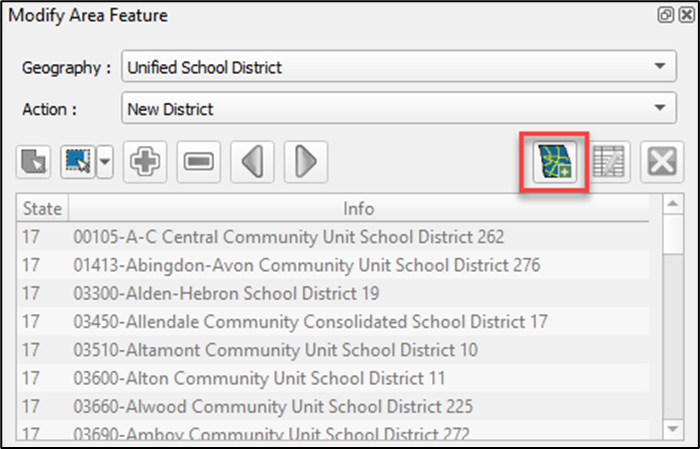
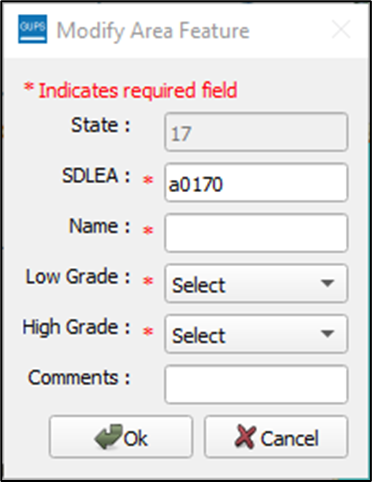
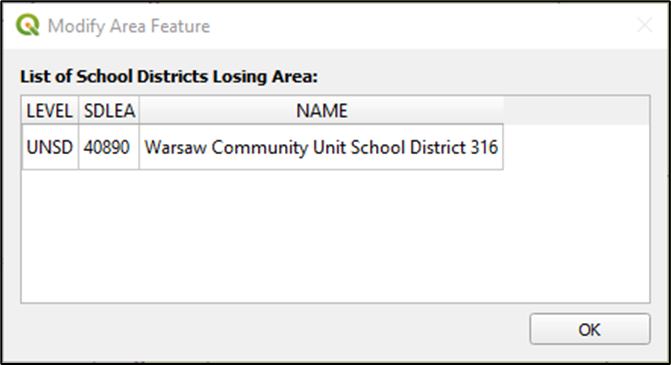
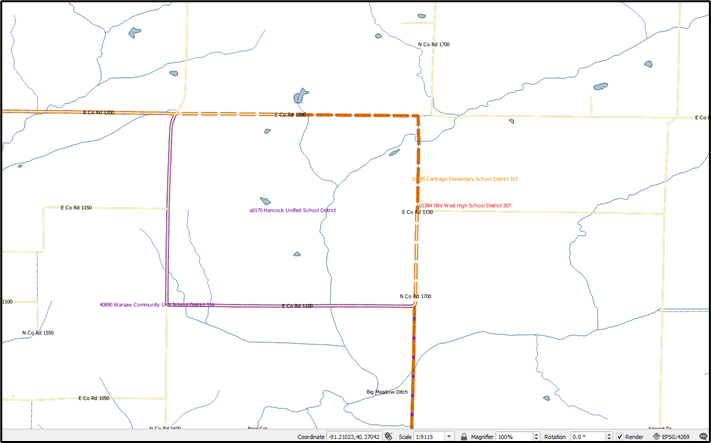
GUPS provides three tools—the SDRP Criteria Review tool, the Geography Review tool, and the Review Change Polygons tool to help review and validate the updates made during the SDRP. The contents of this sub-section detail using each of these three tools and provide examples of errors or warnings that may result.
The SDRP Criteria Review tool is a validation tool that reviews spatial and attribute changes made during the SDRP. The SDRP Criteria Review tool is a mandatory tool that must be run before the export of the file to the Census Bureau. This tool ensures that all changes correctly follow Census Bureau data submission guidelines, and it allows corrections on any item that is flagged for review by the SDRP Criteria Review tool.
The tool reports two problem types: errors and informational warnings. Errors are critical data issues that must be fixed before exporting data to the Census Bureau. Warnings are issues that the Census Bureau would like the mapping coordinator to review. This tool reviews five primary criteria as listed in Table 21.
Table 21: SDRP Criteria Review Tool Error and Warning Messages
Criteria |
Error/Warning |
Fix/Ignore |
Grade Range Overlap (sub-section 5.4.1.1) |
Error |
Must Fix |
Grade Range Coverage Gap (sub-sections 5.4.1.2 and 5.4.1.3) |
Error |
Must Fix |
Partially Dissolved School District (sub-section 5.4.1.4) |
Error |
Must Fix |
Non-contiguous Entities (sub-section 5.4.1.5) |
Warning |
Fix or Ignore |
Multiple Secondary School Districts (SCSDs) to a single Elementary School District (ELSD) (sub-section 5.4.1.6) |
Warning |
Fix or Ignore |
Table 22 covers the steps to use the SDRP Criteria Review tool.
Table 22: Steps to Use the SDRP Criteria Review Tool
Step |
Action and Result |
Step 1 |
Open the SDRP Criteria Review tool from the SDRP toolbar.
Once selected, users may be asked to save the project before the tool can run. All edits must be saved prior to review. If a save-related message appears select Yes. The following window appears indicating the tool’s progress in reviewing all criteria checks.
|
Step 2 |
If the tool determines that spatial and attributes changes have passed review, the following window appears.
The option to open the SDRP Criteria Review tool is presented if the user would like to review any warnings that were previously fixed. In this scenario, all features have passed the criteria review. |
Step 3 |
If errors are found, the following window appears.
|
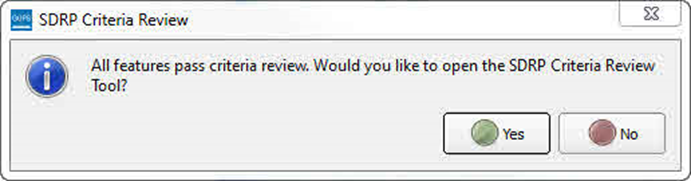
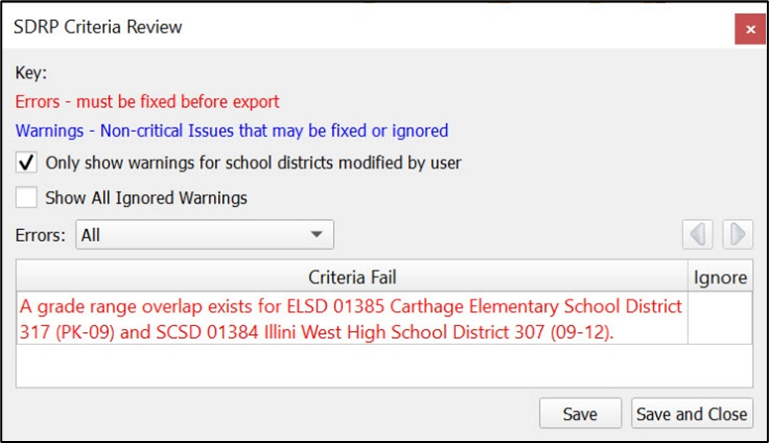
Follow the detailed instructions on correcting the various error types that can occur during the SDRP Criteria Review located in the subsequent sub-sections.
Note: The scenarios provided are intended to be an introduction on how to resolve criteria errors in GUPS and not a comprehensive list of all possible scenarios and solutions that can occur. The steps taken to resolve real-world criteria errors largely depend on the type of edits completed and the local, specialized school district knowledge the mapping coordinator has when making updates during the SDRP.
Grade Range Overlaps occur when one school district contains grade ranges that also exist in another school district occupying the same area. For example, an elementary school district has a grade range of pre-k (PK)-9 while the underlying secondary school district has a grade range of 9-12. This is considered a grade range overlap since both the elementary school district and the secondary school district have ‘9th grade’ in their respective grade ranges. Grade range adjustments need to occur for either the elementary school district or secondary school district to correct this error.
Table 23 illustrates an example where the SDRP Criteria Review tool flagged a grade range overlap that exists between 01385–Carthage Elementary School District 317 and 01384–Illini West High School District 307.
Table 23: Steps to Correct a Grade Range Overlap Error
Step |
Action and Result |
Step 1 |
In this example, the SDRP Criteria Review tool flagged a grade range overlap that exists between 01385–Carthage Elementary School District 317 and 01384–Illini West High School District 307.
Review the error to identify the issue. Both the elementary school district (01385–Carthage Elementary School District 317) and the secondary school district (01384–Illini West High School District 307) have ‘9’ in their grade range coverage. Carthage Elementary’s grade range should only include PK-08. Therefore, an attribute change must occur for Carthage Elementary School District to resolve this issue. |
Step 2 |
To correct the grade range overlap, select 01385–Carthage Elementary School District 317 from the Modify Area Feature window info list as the target layer. Then select the Change Attributes button.
|
Step 3 |
The window opens with editable attributes fields for 01385–Carthage Elementary School District 317.
|
Step 4 |
Change the High Grade attribute from 09 to 08. Then select OK.
|
Step 5 |
In the SDRP Criteria Review tool (still open from its original execution), select the Save button. The criteria check will run again.
If all issues were corrected, a message displays saying all features pass criteria review. Otherwise, continue correcting the failures.
|

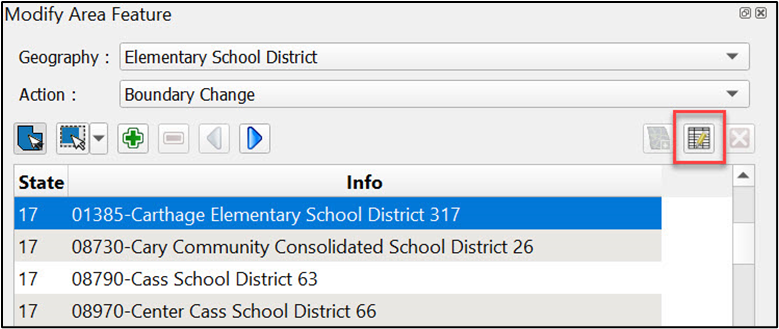
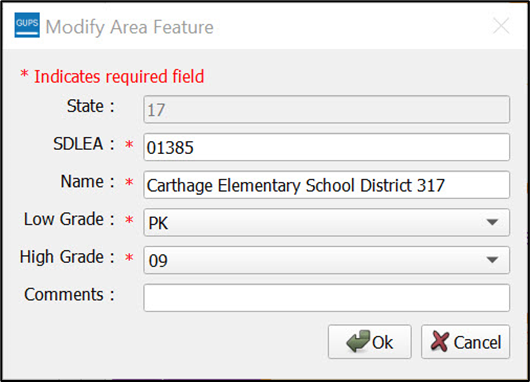
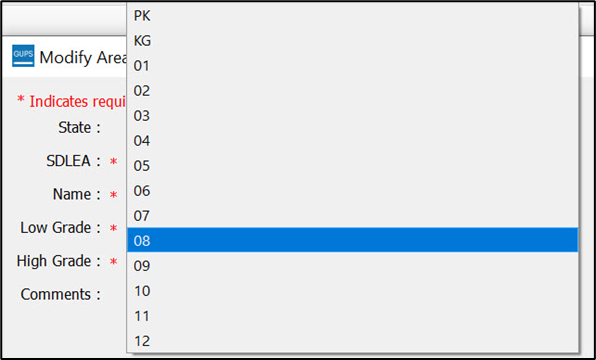

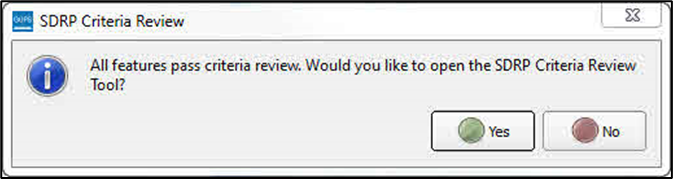
Grade Range Gaps can occur when one, or more, school district geographies have missing grade ranges. In this example a grade range gap (Figure 30) has been identified between 01381–La Harpe Community School District 347 and 01384–Illini West High School District 307. A grade range attribute change could be made to either the elementary school district or the secondary school district. Changing the grade range for La Harpe Community School District from ‘PK-07’ to ‘PK-08’, as described above in Table 23, would resolve the grade range gap error.
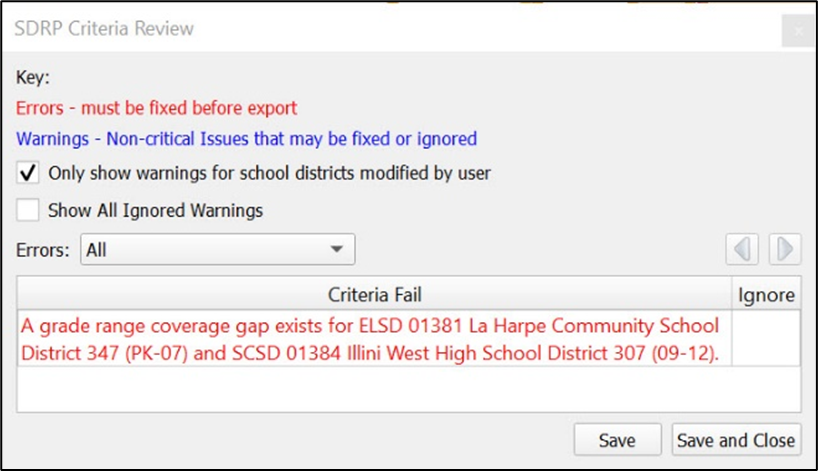
Figure 30: Example of a Grade Range Gap Error–Incorrect Attributes
It is possible that a grade range coverage gap exists because school district geography coverage is missing entirely. For example, during a Complex Consolidation or Boundary Change, faces from a unified school district are added to an elementary school district. The unified school district faces that now belong to the elementary school district are missing secondary school district coverage because GUPS does not automatically apply secondary coverage. Instead of an attribute change, the grade range gap is resolved by adding the secondary school district coverage to those new elementary school district faces through the boundary change action. Refer to Table 13 for steps to make a boundary change using whole faces.
If, during a complex dissolution action, a school district has not been completely dissolved into the target school district(s), the SDRP Criteria Review tool flags this partially dissolved school district as an error (Figure 31). In the example below, 18060–Hamilton Community School District 328 has been flagged as being partially dissolved.
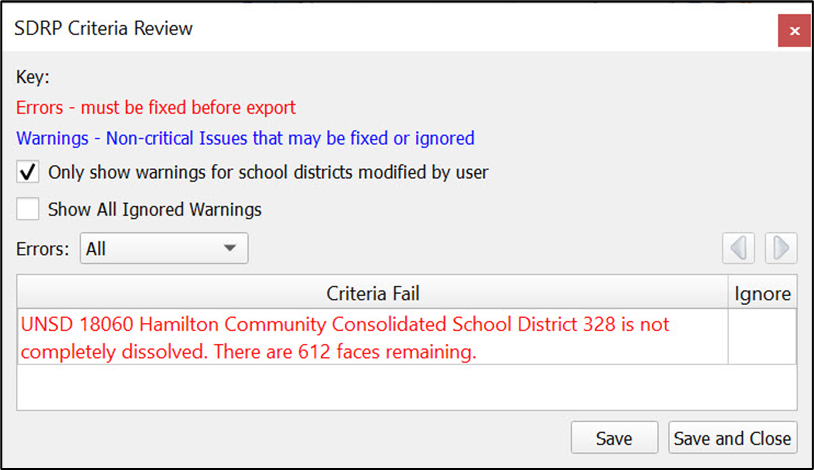
Figure 31: Example of a Partially Dissolved School District Error
The description states how many faces remain to dissolve. In this example, Hamilton Community Consolidated School District 328 has 612 faces that need to be dissolved to complete the dissolution. Open the Modify Area Feature tool and complete the complex dissolution for Hamilton Community Consolidated School District 328. Refer to Table 19 if questions remain on performing this update.
When all faces have been dissolved, select Save in the SDRP Criteria Review tool to rerun the tool to confirm that the error has been resolved. If all faces have been dissolved and no other informational warnings or errors exist, the SDRP Criteria Review tool will indicate that all criteria have passed review.
A noncontiguous entity is a type of informational warning that GUPS provides as a means of data review. Unlike errors, which must be corrected, informational warnings do not require fixing before exporting the file to the Census Bureau. They can either be ignored or fixed. The purpose of these informational warnings is to alert users of any potential data issues created during the SDRP editing phase. The noncontiguous entity warning can be useful if, for example, during the creation of a new school district, some faces were missed.
It is possible to ignore a noncontiguous warning. If modifying or creating a school district has resulted in a noncontiguous school district with legitimate data changes, the criteria review gives the option to ignore the warning.
The second type of informational warning involves the assignment of multiple secondary school districts to a single elementary school district.
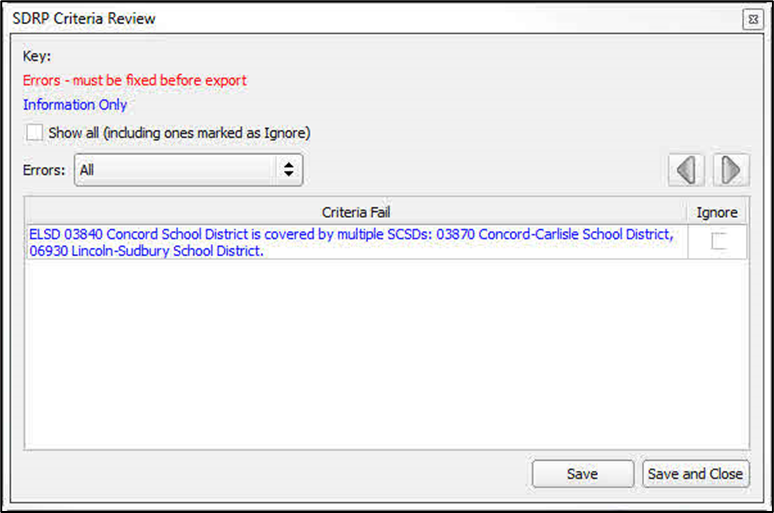
Figure 32: Informational Warning (Multiple Secondary School Districts–Single School District)
In this example, illustrated in Figure 32, the SDRP Criteria Review tool found that ELSD 03840 Concord School District is covered by multiple SCSDs (03870 and 06930). Upon review, a boundary correction to ELSD Concord resulted in a single face being covered by SCSD Lincoln-Sudbury while the balance of Concord is covered by SCSD Concord-Carlisle. Resolving these types of warnings will largely depend on the local, specialized knowledge regarding the behavior of school district geography.
For this example, the following three solutions could be used to resolve this warning.
Ignore–The change in geography is correct and should be left as is.
Boundary Change–The face should belong to ELSD Lincoln-Sudbury School District and not ELSD Concord School District.
New SCSD–Include this face in a new secondary school district.
By default, the SDRP Criteria Review tool will only display warnings for school districts that have been modified by a user as indicated by the checkmark next to the “Only show warnings for school district modified by user” option. Unchecking this option may display warnings for other school districts in the state that were not included as updates during the SDRP. If time allows the mapping coordinator can review these warnings, but the priority should be warnings identified for school districts modified by a user first.
The second option is the checkbox for ‘Show All Ignored Warnings.” When informational warnings have been ignored, the SDRP Criteria Review tool removes these items from the Criteria Fail list. To review any previously ignored informational warnings, select the show all check box. Unchecking the Show All Ignored Warnings check box hides these items from the Criteria Fail list (Figure 33).
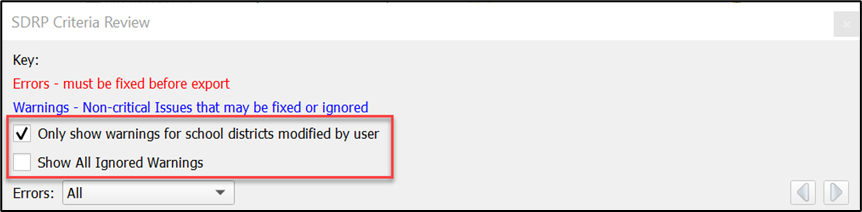
Figure 33: Information Warning Check Boxes
Note: When the Show All checkbox is selected, the Ignore checkbox for previously ignored informational warnings is disabled. Informational warnings marked as ignore cannot be unchecked once changes are saved in the SDRP Criteria Review tool.
The Geography Review tool filters the map layers based on various fields in the attribute table. Use this tool to check the updates made to linear features and school districts. This tool may also be used to view the attributes of entities, features, and boundaries that were not changed. Steps for using the Geography Review tool information appear in Table 24.
Table 24: Steps to Use the Geography Review Tool
Step |
Action and Result |
Step 1 |
Select the Geography Review tool from the SDRP toolbar.
The Geography Review Tool window opens.
|
Step 2 |
From the Layer Name drop-down menu select the data layer to view.
For this example, select “sdrpst24_17_changes_unsd.” This is a change polygon created from updating a unified school district layer. |
Step 3 |
Once selected, the attribute table opens and the attributes for each unified school district that changed are displayed.
|
|
If all the columns in the attribute data table are not visible, drag the edge of the window outward to widen the view. Alternatively, move the window to another location by selecting inside the box and dragging it. |
Step 4 |
To view the unified school district on the map, select the corresponding row in the attribute table, then choose the Zoom button in the window. The row is highlighted, and the map automatically zooms to the unified school district. The feature will be highlighted yellow–color may vary.
|
Step 5 |
To view other unified school districts in the table rows, use the Previous Zoom and Next Zoom buttons. Selecting each button automatically zooms and highlights the feature for that row.
|
Step 6 |
Use the Search feature at the bottom of the window to filter the table layers by specific attributes (e.g., full name, MAF/Feature Class Code (MTFCC), change type, etc.)
For this example, select change type (CHNG_TYPE) and choose M–Merge/Complex Consolidation. After selecting the Search button, the attribute table is filtered to show the rows for only those records with a CHNG_TYPE ‘M’.
|
|
The drop-down list of
CHNG_TYPES is a global list for all Census Bureau programs,
therefore there are more CHNG_TYPES available than are used in
the SDRP. The following CHNG_TYPES are those specific to the
SDRP: A–Annexation or Addition; M–Merge/Complex
Consolidation; |
Step 7 |
To view an individual record, select its row and choose the Zoom button. To return to the attribute table to see a full, unfiltered, unified school district layer select the Refresh button in the upper right-hand corner of the window.
|
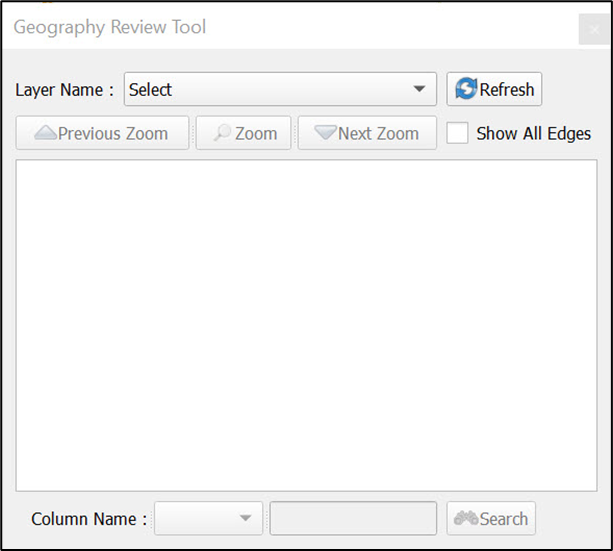
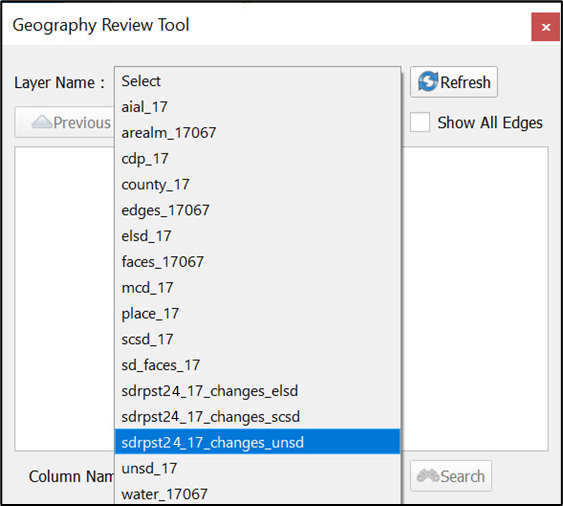
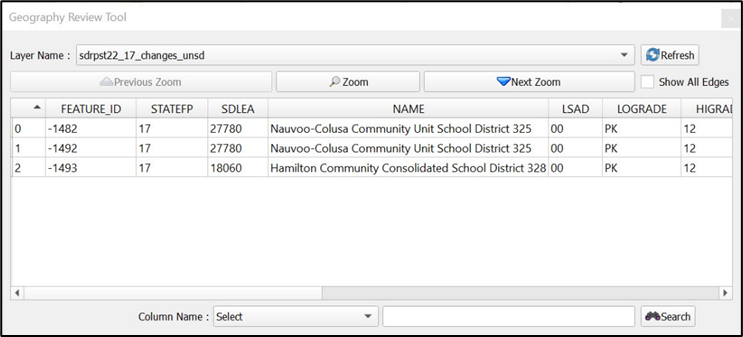
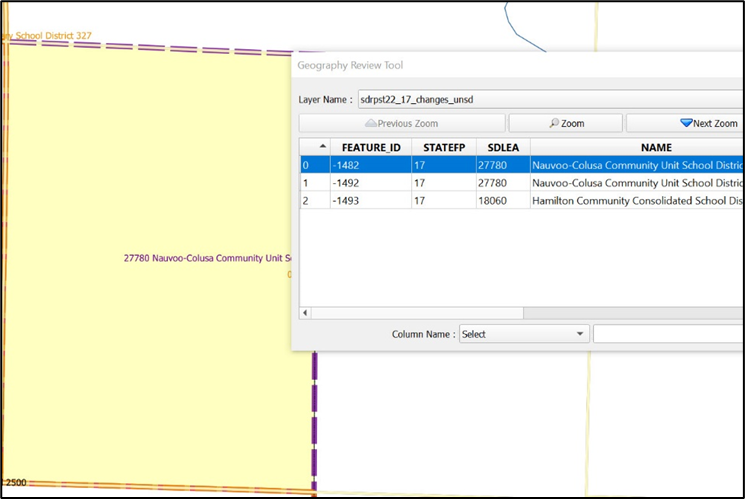
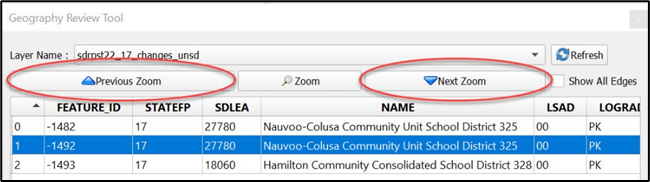
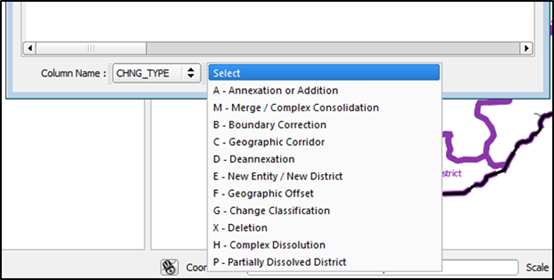
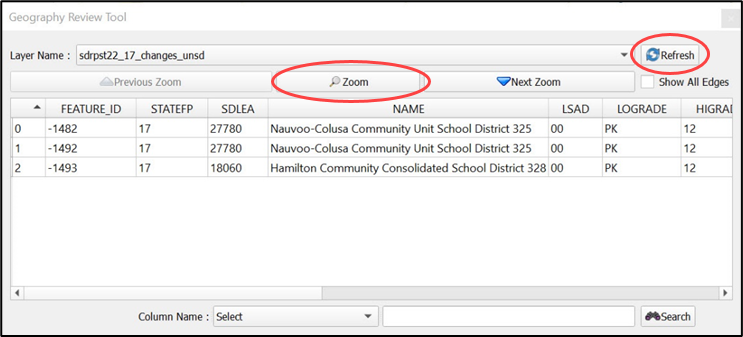
The Review Change Polygons tool, described in Table 25, allows the user to view the transactions created from school district boundary edits.
Table 25: Steps to Use the Review Change Polygons Tool
Step |
Action and Result |
Step 1 |
Select the Review Change Polygons tool from the SDRP toolbar.
The Review Change Polygons window opens just below the Table of Contents.
|
Step 2 |
Use the Geography drop-down menu to select the school district geography type to review. In this example, select Elementary School District.
|
Step 3 |
After selecting the geography type, the window populates with all change polygon transactions for the selected school district level. This elementary school district has two transactions for a complex consolidation.
|
Step 4 |
To view the polygon related to the transaction, select the row for the polygon in the list. The map zooms to the location of the polygon and highlights that polygon on the map (highlight is yellow, but color may vary.)
|
Step 5 |
Once the review is complete, close the Review Change Polygons tool by selecting the Close button in the lower right-hand corner.
|
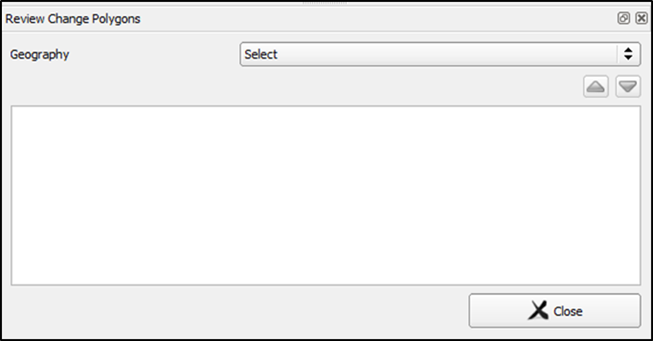
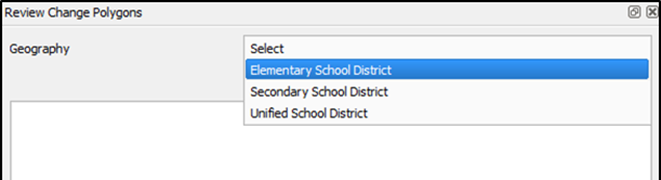
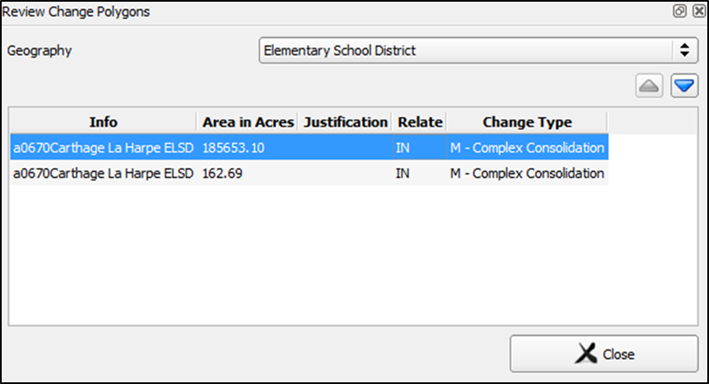
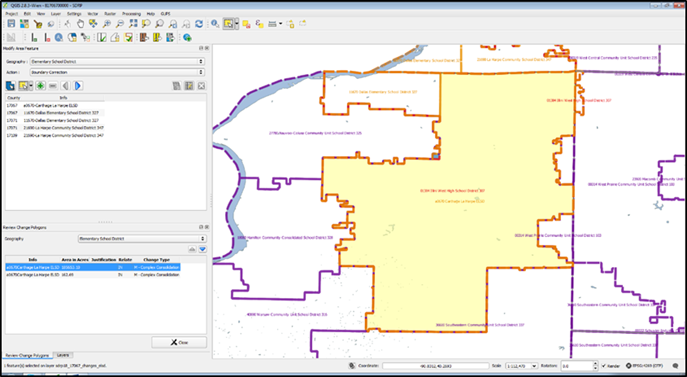
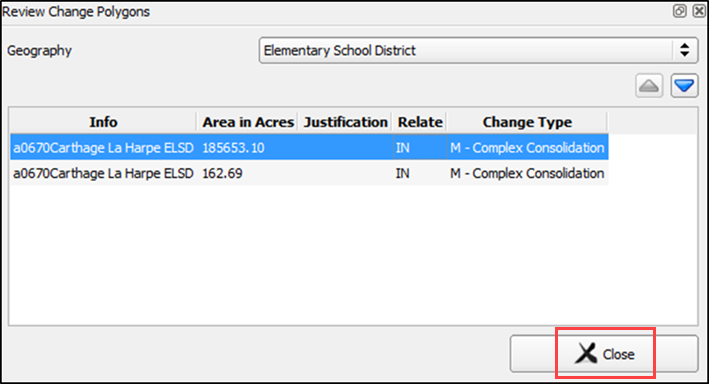
There are two options for creating export Zip files: export a file to share with another participant and export a file for submission to the Census Bureau. Exporting a file to share with another participant does not require all errors to be resolved and exports the whole project, including all reference files. It may be useful to use this option if a school district or county completes their updates, and they want to send the results to the mapping coordinator for review.
Exporting a file for submission to the Census Bureau requires all SDRP criteria review errors to be resolved. The Census Bureau will only accept this file export for submission. In either case, GUPS automatically names the output Zip file. It packages all files required by the Census Bureau into the Zip file and saves it in the default GUPS project directory.
To export a file to share with another participant, follow the steps in Table 26.
Table 26: Steps to Export a File to Share with Another Participant
Step |
Action and Result |
Step 1 |
Select on the Export to Zip button on the SDRP toolbar.
|
Step 2 |
The Select Output Type window opens. Select the Share with Another Participant radio button. Then choose OK to continue.
|
Step 3 |
The Export to Zip window opens and displays the location of the export file. Select Yes to view the folder with the export file or No to close the window.
Note: The screenshot above is for illustration purposes only and does not reflect the current SDRP year. When running the Export to Zip tool, folder names and files names created during export will reflect the correct SDRP year SDRPST25. |
Step 4 |
Selecting Yes displays the folder location where GUPS placed the zipped file.
Note: GUPS automatically saves the file to an output folder that the GUPS installer placed on the computer during the installation process. |
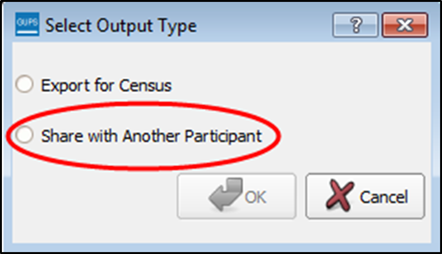
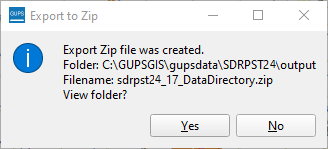
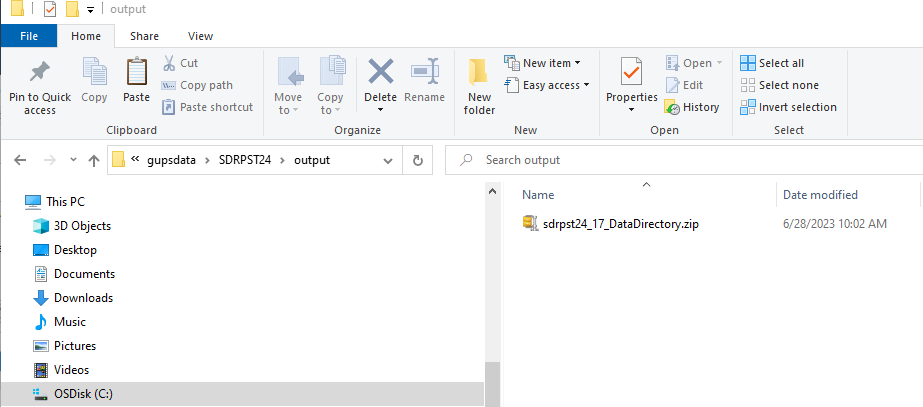
To export a file for submission to the Census Bureau follow the steps in Table 27.
Table 27: Steps to Export a File for Submission to the Census Bureau
Step |
Action and Result |
Step 1 |
Select on the Export to Zip button on the SDRP toolbar.
|
Step 2 |
The Select Output Type window opens. Select the Export for Census radio button. Then choose OK to continue.
|
Step 3 |
If the SDRP Criteria Review tool was not previously executed, the Export to Zip window displays the SDRP Criteria Review check with a status of NEEDED.
If this message appears, select the Cancel button, run the SDRP Criteria Review tool, and resolve any errors. Check the “Show All Ignored Warnings” box, as shown in Figure 33, for all informational messages that are valid. Then repeat the export steps again. |
Step 4 |
If the SDRP Criteria Review tool was previously executed, the Export to Zip window displays the status of the check and the date and time the checks were made, as shown below.
Review the run times listed. If any additional changes were made after the time displayed, select Cancel and run the SDRP Criteria Review tool again. Then repeat the export steps. To continue with the export, select OK. |
Step 5 |
The Export to Zip window opens and displays the location of the export file. Select Yes to view the folder with the export file or No to close the window.
|
Step 6 |
Selecting Yes displays the folder location where GUPS placed the zipped file.
Note: GUPS automatically saves the file to an output folder that the GUPS installer placed on the computer during the installation process. |
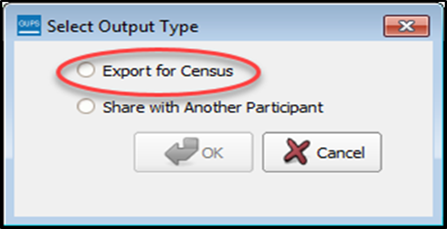
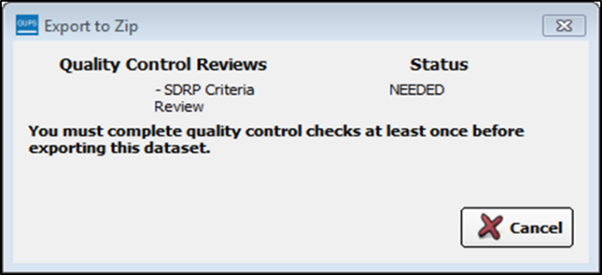
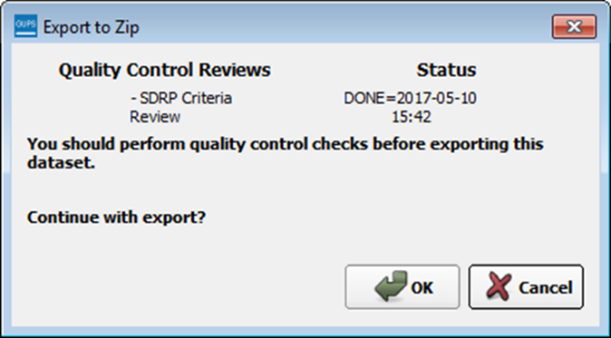
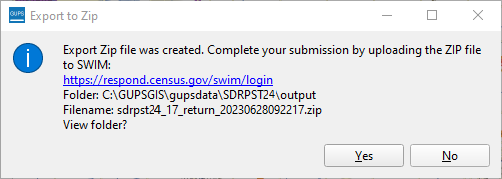
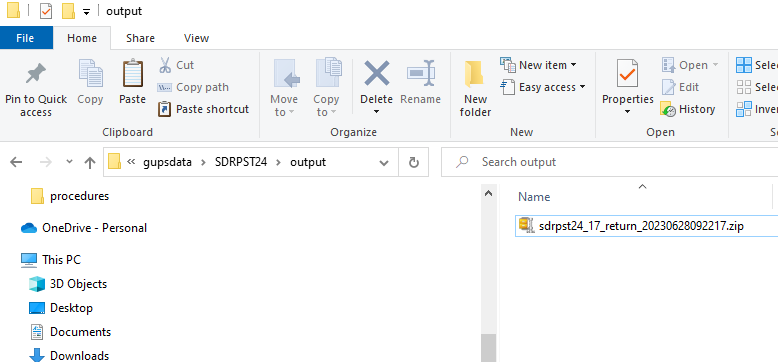
Proceed to the final part of the guide to learn about submitting files to the Census Bureau.
All submissions for the SDRP must be sent to the Census Bureau using the SWIM. Use the instructions in this chapter to establish or access a SWIM account and submit the state’s SDRP zipped GUPS export file, zipped updated listing files, and/or zipped submission log.
Some mapping coordinators may have an existing SWIM account. If so, submit the state’s SDRP submission using that existing account. For mapping coordinators without an established account, contact the SDRP team to request a registration token. Once a SWIM token has been assigned, create a SWIM account.
To check for the existence of a SWIM account or to reset a password on an established account, choose “Forgot your password?” on the main SWIM page and enter the email address in question to check for the existence of an account. If SWIM locates an account, it asks the established security question for the account, for which the answer is not case-sensitive, and sends an email to reset the forgotten password. If SWIM does not locate an account associated with the email address, it returns the following message, “No account registered for this email address. The email address associated with the account is case sensitive. Try again with the proper case or go to Account Registration to register for a SWIM account.” Choosing the Account Registration link opens another window to establish a SWIM account; however, the person must have a registration token to proceed.
Note: The components of both the email address and the password of SWIM accounts are case-sensitive. Make note of the format used when establishing the SWIM account (e.g., jane@anytown.org or Jane@anytown.org or JANE@ANYTOWN.ORG.)
SWIM allows four attempts to login before it temporarily locks the account for 15 minutes. After the lock expires, try to login again or reset the password using the aforementioned “Forgot your password?” link on the login page. Once reset and logged into SWIM, account holders may modify their password and security answer by selecting “Change Security” link along the top, right side of the window.
SWIM file requirements include submission of .zip file format. The .zip file may not include another .zip file as a component and it must not be larger than 250 megabytes. To send Annotation Phase changes to the Census Bureau, follow the instructions in Table 28. If problems still occur with SWIM, contact the SDRP team because it may be necessary to create a new SWIM account.
Step |
Action and Result |
Step 1 |
Open a new browser window and enter the URL: <https://respond.census.gov/swim>. The SWIM login screen opens.
|
Step 2 |
For users that already have a SWIM account enter the email address and password. The email and password are case sensitive. Select the Login button. Skip to Step 7. |
Step 3 |
Users without a SWIM account must register. Select the Register Account button. The Account Registration screen opens. All fields on the Account Registration screen are required. |
|
While working in SWIM obtain help by selecting the Help button on any screen. A screen opens with links to help resources.
|
Step 4 |
On the Account Registration screen, enter the 12-digit token provided by the Census Bureau, then enter contact name, agency, and email in the appropriate fields. |
Step 5 |
Create a password. The passwords must meet the five criteria below:
Note: The commas shown immediately above are to separate the special characters listed. A comma is not a valid character for the password |
Step 6 |
Set up a security question (choose the arrow on the right of the Security Question box and select a question in the drop-down list, then enter an answer in the Answer box). When finished, select the Submit button. A screen opens to confirm that the account has been successfully registered.
Choose Login to return to the SWIM Login screen to enter the newly established account login and password information. |
Step 7 |
Enter the account login and password information and choose the Login button.
|
Step 8 |
With a valid login and password, the Welcome screen opens. To begin the submission process, choose the Start New Upload button.
|
Step 9 |
The “What Census program are you reporting data for?” window opens. Select the School District Review Program radio button, and then choose Next at the bottom of the screen.
|
Step 10 |
The Select a State window opens asking which state is being reported. Select the radio button next to the appropriate state and then choose the Next button to continue.
|
Step 11 |
The Select a .zip file to upload screen opens.
|
Step 12 |
To upload a .zip file, select the + Add File button on the screen to open a window that allows the user to navigate to the .zip file’s location.
|
|
More than one .zip file
can be added for upload in the SWIM session by repeating use of
the |
Step 13 |
Locate the .zip file(s) to upload and then double-click the left mouse button to add it to the window for upload. The Progress field on the Select a .zip file to upload screen shows the progress of the upload. Once the upload is complete, the Status field shows Success, and the name of the file appears in the File(s) field.
|
Step 14 |
Type any comments in the Comments field. Select the Next button.
|
Step 15 |
The Thank You page confirms the receipt of the submission. To add additional files, choose the upload form link in the phrase You may Log Out or return to the upload form, to submit more files. This choice returns to the Welcome screen. Otherwise, to log out, select Log Out.
|
|
Be aware SWIM sessions deactivate after 15 minutes of inactivity. |
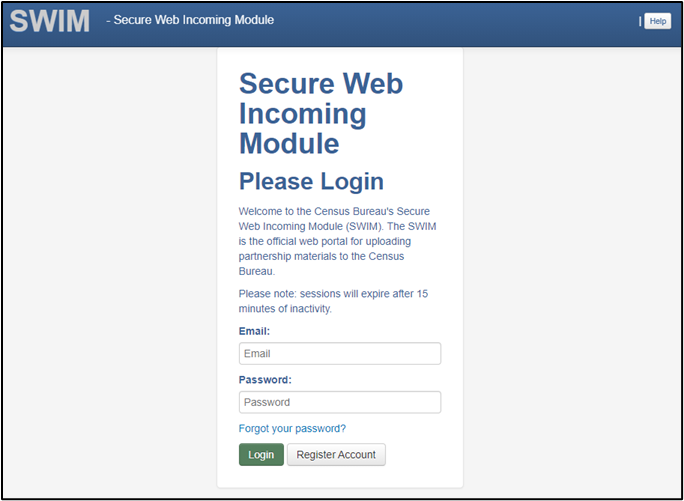
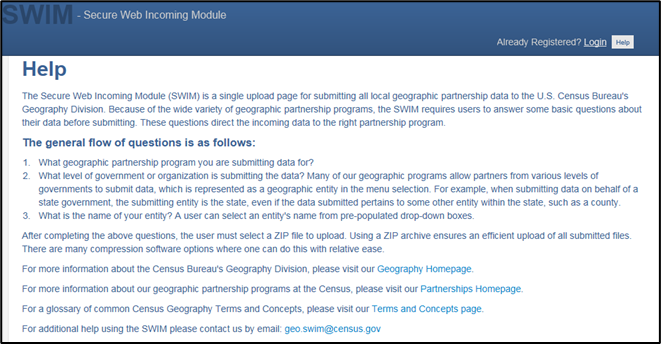
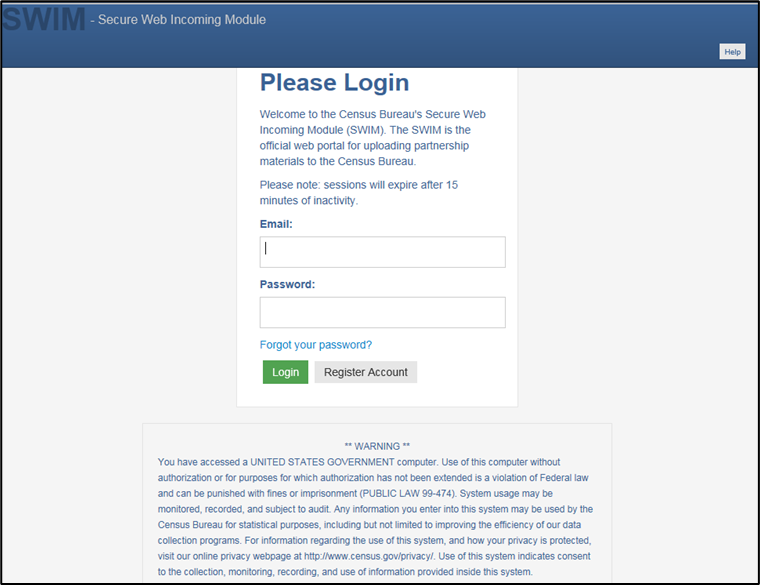
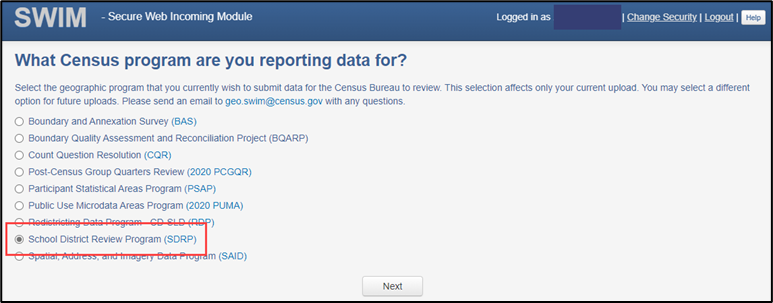
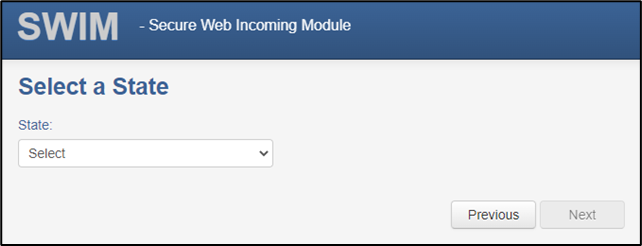
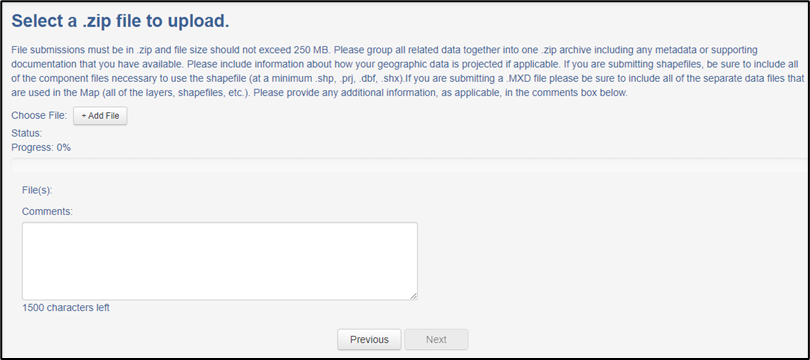
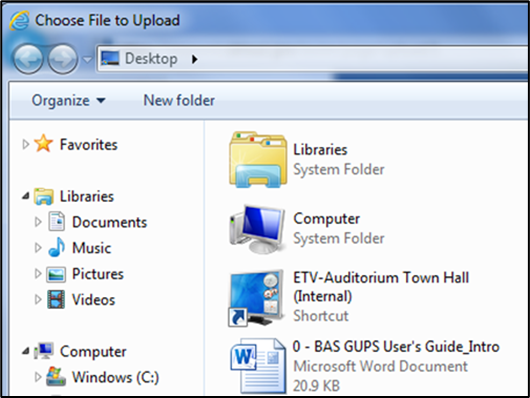
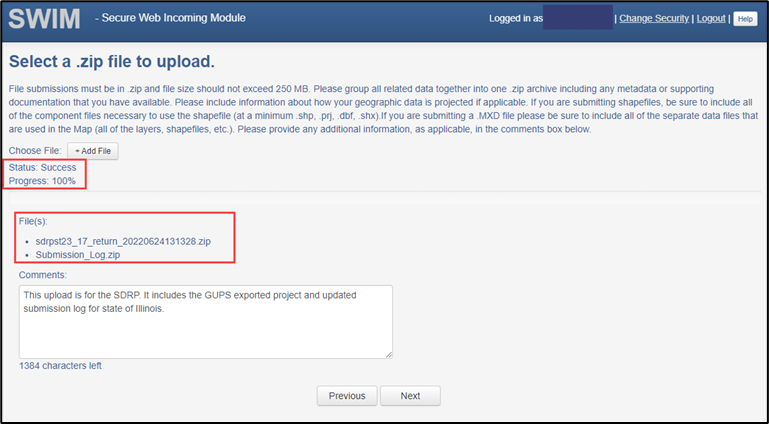
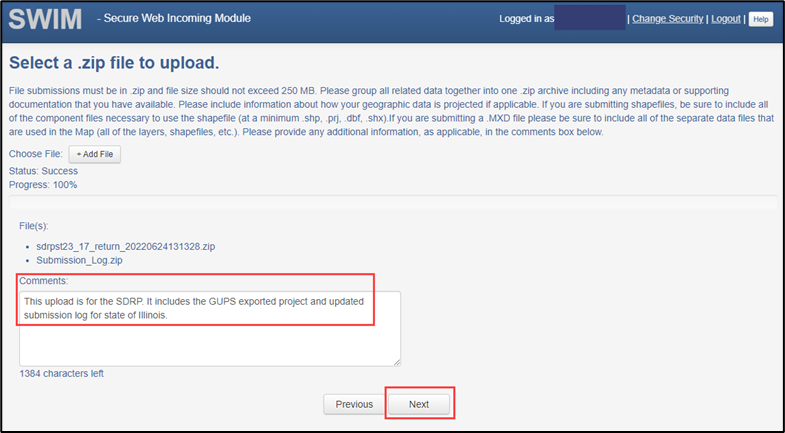
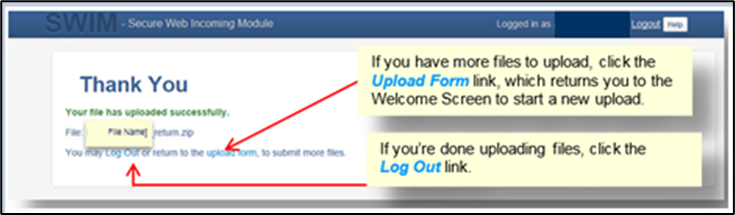
Appendices
The Census Bureau categorizes school districts based on the grade ranges for which the school district is financially responsible. These may or may not be the same as the grade ranges that a school district operates. The grade range that reflects financial responsibility is important for the allocation of Title I funds. Following are examples of how the Census Bureau represents financial responsibility.
When a school district is financially responsible for providing education for one set of grades in one geographic area and financially responsible for a different set of grades in a different geographic area, the Census Bureau may create a pseudo school district to properly allocate Title I funds. For example, a school district that is financially responsible for grades K-12 in one geographic area is also financially responsible to educate students in grades 9-12 from a neighboring district covering a different geographic area. The Census Bureau creates a pseudo school district to identify the financially responsible district for grades 9-12 covering the geographic area of the neighboring district. The pseudo district is associated with the regular district so that the regular district is given “credit” for the additional financial responsibility. Consider the example of Science Hill Independent School District.
The Science Hill Independent School District has very few children in grades 9-12, so those children attend school in the Pulaski County School District (Figure 34). Pulaski County School District is financially responsible for educating children in grades 9-12 who live in the Science Hill Independent School District and Pulaski County School District is financially responsible for educating children in grade ranges K-12 within Pulaski County, outside of the Science Hill Independent School District. Therefore, the Census Bureau created the pseudo district “Pulaski County School District for Science Hill” using the same boundaries as the Science Hill Independent School District and assigned grades 9-12 to “Pulaski County School District for Science Hill.” The Science Hill Independent School District is assigned grades K-8 while the Pulaski County School District maintains its grades K-12.
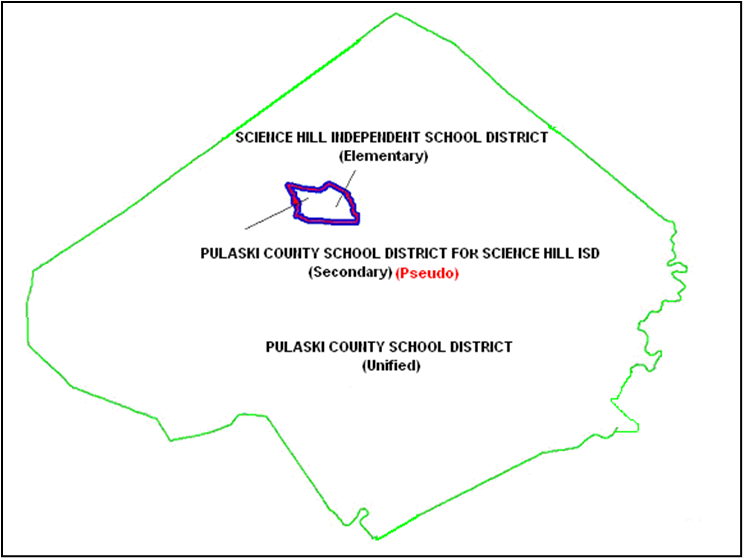
Figure 34: Example of a Pseudo School District–Pulaski County, KY
These pseudo districts are identified in the Inventory and Grade Range file by a flag with a value of "A." In the School District Boundary shapefiles, pseudo districts are identified by an SDTYPE of “A.”
Additionally, the Census Bureau assigns them a pseudo SDLEA code and a school district name that is slightly different from the official name of the school district. They appear in the Inventory and Grade Range Listing1 as shown in Table 29.
Table 29: Pseudo School Districts in the Inventory and Grade Range Listing File
STATE CODE |
SDLEA |
LOGRADE |
HIGRADE |
SDLEVEL |
SDTYPE |
NAME |
21 |
04950 |
PK |
12 |
U |
-- |
Pulaski County School District |
21 |
21002 |
09 |
12 |
S |
A |
Pulaski County School District for Science Hill ISD |
21 |
05220 |
PK |
08 |
E |
-- |
Science Hill Independent School District |
When submitting a pseudo school district, provide the following information:
Official school district name and SDLEA code.
Alternate grade range.
Service area of alternate grade range.
Currently, the Census Bureau has defined pseudo school districts in California, Georgia, Illinois, Kentucky, Massachusetts, Minnesota, New Jersey, Tennessee, Texas, and Vermont. To discuss school districts that fit the above description, contact the SDRP team.
When a school district is financially responsible for all grades, but only operates schools with elementary grades, the Census Bureau classifies this as a PK/KG-12 Elementary School District. For example, a school district operates schools for children in grades Kindergarten (KG)-8 and pays a neighboring school district to educate children in grades 9–12. The first school district is operationally responsible for grades KG-8, but financially responsible for grades KG-12. If an elementary school district is financially responsible for grades KG-12 or Pre-Kindergarten (PK)–12, there will be no secondary school district represented for that area. In cases where an elementary school district is financially responsible for only lower grades, there is generally a secondary school district that is financially responsible for providing educational services for the upper grades.
The Census Bureau produces Excel files for the Annotation Phase. The listing file names will be followed by “_A”; e.g., <ST>_SD_Inventory_A.xlsx where <ST> = two-digit state code. Use the information in the sub-appendices to learn about the attributes contained in each listing.
Note: The NCESID, and variations of it in the NCES data, is a seven-digit identification code that is composed of the two-digit state code and five-digit SDLEA code. Each of the tables in this appendix contain these two fields.
These files follow the naming convention of <ST>_SD_Inventory_A.xlsx. Table 30 describes the fields in the file, their length, data type, a brief description of the field, and the valid value ranges.
Table 30: Data Dictionary for the Inventory and Grade Range File
Attribute Field |
Length |
Type |
Description |
Value/Range |
STATE CODE |
2 |
VARCHAR |
State code |
01, 02, 04-06, 08-13, 15-42, 44-51, 53-56 |
SDLEA |
5 |
VARCHAR |
School district local education agency code |
00001-99998 |
LOGRADE |
2 |
VARCHAR |
School district low grade |
PK, KG, 01-11 |
HIGRADE |
2 |
VARCHAR |
School district high grade |
PK, KG, 01-12 |
SDLEVEL |
1 |
VARCHAR |
School district level |
E=Elementary; S=Secondary; U=Unified; A=Administrative Area |
SDTYPE |
1 |
VARCHAR |
School district type |
A=Pseudo; B=Dept. of Defense; C=Interstate; D=Bureau of Indian Affairs; E=Same Name |
NAME |
100 |
VARCHAR |
School district name |
Not Blank |
These files follow the naming convention <ST>_County_Coverage_A.xlsx. Table 31 describes the fields in the file, their length, data type, a brief description of the field, and the valid value ranges.
Table 31: Data Dictionary for the County Coverage File
Attribute Field |
Length |
Type |
Description |
Value/Range |
STATE CODE |
2 |
VARCHAR |
State code |
01, 02, 04-06, 08-13, 15-42, 44-51, 53-56 |
COUNTY CODE |
3 |
VARCHAR |
County code |
001-840 |
COUNTY NAME |
100 |
VARCHAR |
County name |
Not Blank |
SDLEA |
5 |
VARCHAR |
School district local education agency code |
00001-99998 |
NAME |
100 |
VARCHAR |
School district name |
Not Blank |
These files follow the naming convention <ST>_Coextensive_Coverage_A.xlsx. Table 32 describes the fields in the file, their length, data type, a brief description of the field, and the valid value ranges.
Table 32: Data Dictionary for the Legal Government Coextensive Coverage File
Attribute Field |
Length |
Type |
Description |
Value/Range |
STATE CODE |
2 |
VARCHAR |
State code |
01, 02, 04-06, 08-13, 15-42, 44-51, 53-56 |
COUNTY CODE |
3 |
VARCHAR |
County code |
001-840 |
COUNTY NAME |
100 |
VARCHAR |
County name |
Not Blank |
SDLEA |
5 |
VARCHAR |
School district local education agency code |
00001-99998 |
SDLEVEL |
1 |
VARCHAR |
School district level |
E=Elementary; S=Secondary; U=Unified; A=Administrative Area |
SDNAME |
100 |
VARCHAR |
School district name |
Not Blank |
COEXTWITH |
100 |
VARCHAR |
Name of government the school district is coextensive with |
Not Blank |
FIPS55 CODE |
5 |
VARCHAR |
Federal Information Processing Series (FIPS) code (formerly FIPS 55) of the place the school district is coextensive with. This field is only populated when the coextensive government is a place. |
00001-89999 |
These files follow the naming convention <ST>_SD_GEO_Relationship_A.xlsx. Table 33 describes the fields in the file, their length, data type, a brief description of the field, and the valid value ranges.
Table 33: Data Dictionary for the School District to Geography Relationship File
Attribute Field |
Length |
Type |
Description |
Value/Range |
SDLEA |
5 |
VARCHAR |
School district local education agency code |
00001-99998 |
SDLEVEL |
1 |
VARCHAR |
School district level |
E=Elementary; S=Secondary; U=Unified; A=Administrative Area |
SDNAME |
100 |
VARCHAR |
School district name |
Not Blank |
COUNTY SUBDIVISION ‘PART’ FLAG |
1 |
VARCHAR |
School district partially covers county subdivision part flag |
P |
STATE CODE |
2 |
VARCHAR |
State code |
01, 02, 04-06, 08-13, 15-42, 44-51, 53-56 |
COUNTY CODE |
3 |
VARCHAR |
County code |
001-840 |
COUNTY SUBDIVISION CODE |
5 |
VARCHAR |
County subdivision code |
00000-98999 |
COUNTY SUBDIVISION NAME |
100 |
VARCHAR |
County subdivision name |
Not Blank |
COUNTY SUBDIVISION NAME SUFFIX |
50 |
VARCHAR |
County subdivision name suffix |
Barrio, borough, CCD, census subarea, census subdistrict, city, county, district, precinct, gore, grant, location, municipality, plantation, barrio-pueblo, purchase, town, township, UT, village, charter township, reservation, no suffix exists |
PLACE ‘PART’ FLAG |
1 |
VARCHAR |
School district partially covers incorporated place part flag |
P |
PLACE CODE |
5 |
VARCHAR |
Place code |
00001-89999 |
PLACE NAME |
100 |
VARCHAR |
Place name |
Not Blank |
PLACE SUFFIX |
50 |
VARCHAR |
Incorporated place name suffix |
Borough, city, metro township, municipality, town, village, city and borough, consolidated government, corporation, metropolitan government, urban county, unified government, no suffix exists |
There are two series
of shapefiles, one set for the state-level files and one set for
county level files, described in this appendix. The tables included
below list the types of data included in each series. Additional
details for each of the shapefiles listed in this appendix are in
Appendix D.
State-level Shapefile Names–PVS_<yy>_v1_<layername>_<SS>.shp, where <yy> is the year, <layername> is the abbreviated shapefile name, and <SS> is the two-digit state code. Descriptions for abbreviated state shapefile names are provided in Table 34.
Table 34: Abbreviated State Shapefile Names
<layername> |
Description |
aial |
American Indian Areas–Legal |
cdp |
Census Designated Places |
county |
Counties and Equivalent Areas |
mcd |
Minor Civil Divisions (County Subdivisions) |
place |
Incorporated Places |
elsd |
Elementary School Districts |
scsd |
Secondary School Districts |
sdadm |
School District Administrative Areas (Vermont only) |
unsd |
Unified School Districts |
County-level Shapefile Names–PVS_<yy>_v1_<layername>_<STCOU>.shp, where <yy> is the year, <layername> is the abbreviated shapefile name, and <STCOU> is the five-digit state and county code. Descriptions for abbreviated county shapefile names are provided in Table 35.
Table 35: Abbreviated County Shapefile Names
<layername> |
Description |
arealm |
Area Landmarks |
edges |
All Lines |
faces |
Topological Faces (Topological Polygons) |
water |
Hydrography–Area |
The tables in this appendix detail each shapefile by defining the layout of each file. Tables 36–44 correspond to the state-level shapefiles while tables 45–48 correspond to the county-level shapefiles. Refer to these tables for information about the shapefiles that appears in GUPS.
Table 36: American Indian Areas (aial)–Legal
Attribute Field |
Length |
Type |
Description |
STATEFP |
2 |
String |
State code |
BASID |
11 |
String |
11-digit Boundary and Annexation Survey (BAS) ID |
AIANNHCE |
4 |
String |
Census American Indian, Alaska Native, Native Hawaiian (AIANNH) area code |
COMPTYP |
1 |
String |
Indicates if record is reservation (or equivalent) or off-reservation trust land portion of AIANNH area |
AIANNHFSR |
1 |
String |
Flag indicating level of recognition of an AIANNH tribe or group |
NAMELSAD |
100 |
String |
Name with translated Local/Statistical Area Definition (LSAD) |
AIANNHNS |
8 |
String |
American National Standards Institute feature code for the county or equivalent area code for AIANNH area |
LSAD |
2 |
String |
Legal/Statistical Area Description code |
FUNCSTAT |
1 |
String |
Functional status code |
CLASSFP |
2 |
String |
Class code |
PARTFLG |
1 |
String |
Part flag indicator, indicates if only part of a feature is represented |
CHNG_TYPE |
2 |
String |
Type of area update |
EFF_DATE |
10 |
Date |
Effective date or vintage |
AUTHTYPE |
1 |
String |
Authorization type for legal area updates |
DOCU |
120 |
String |
Supporting documentation |
AREA |
10 |
Number |
Acreage of area update |
RELATE |
120 |
String |
Relationship description |
JUSTIFY |
150 |
String |
Justification |
NAME |
100 |
String |
Name AIANNH area |
VINTAGE |
2 |
String |
Vintage |
Table 37: Census Designated Places (cdp)
Attribute Field |
Length |
Type |
Description |
STATEFP |
2 |
String |
State code |
PLACEFP |
5 |
String |
Place code |
PLACENS |
8 |
String |
American National Standards Institute feature code for the county or equivalent area feature code for the place |
NAMELSAD |
100 |
String |
Name with translated Legal/Statistical Area Description (LSAD) |
LSAD |
2 |
String |
Legal/Statistical Area Description code |
FUNCSTAT |
1 |
String |
Functional status code |
CLASSFP |
2 |
String |
Class code |
PARTFLG |
1 |
String |
Part flag indicator, indicates if only part of a feature is represented |
CHNG_TYPE |
2 |
String |
Type of area update |
EFF_DATE |
10 |
Date |
Effective date or vintage |
RELATE |
120 |
String |
Relationship description |
JUSTIFY |
150 |
String |
Justification |
NAME |
100 |
String |
Name of the CDP |
VINTAGE |
2 |
String |
Vintage |
Table 38: County and Equivalent Areas (county)
Attribute Field |
Length |
Type |
Description |
STATEFP |
2 |
String |
State code |
COUNTYFP |
3 |
String |
County code |
BASID |
11 |
String |
11-digit Boundary and Annexation Survey (BAS) ID |
COUNTYNS |
8 |
String |
American National Standards Institute feature code for the county or equivalent area |
NAMELSAD |
100 |
String |
Name with translated Local/Statistical Area Definition (LSAD) |
LSAD |
2 |
String |
Legal/Statistical Area Description code |
FUNCSTAT |
1 |
String |
Functional status code |
CLASSFP |
2 |
String |
Class code |
CHNG_TYPE |
2 |
String |
Type of area update |
EFF_DATE |
10 |
Date |
Effective date or vintage |
AUTHTYPE |
1 |
String |
Authorization type for legal area updates |
DOCU |
120 |
String |
Supporting documentation |
AREA |
10 |
Number |
Acreage of area update |
RELATE |
120 |
String |
Relationship description |
JUSTIFY |
150 |
String |
Justification |
NAME |
100 |
String |
Name |
VINTAGE |
2 |
String |
Vintage |
Table 39: County Subdivisions (mcd)
Attribute Field |
Length |
Type |
Description |
STATEFP |
2 |
String |
State code |
COUNTYFP |
3 |
String |
County code |
BASID |
11 |
String |
11-digit Boundary and Annexation Survey (BAS) ID |
COUSUBFP |
5 |
String |
County subdivision code |
NAMELSAD |
100 |
String |
Name with translated Local/Statistical Area Definition (LSAD) |
COUSUBNS |
8 |
String |
American National Standards Institute feature code for the county or equivalent area feature code for the county subdivision |
LSAD |
2 |
String |
Legal/Statistical Area Description code |
FUNCSTAT |
1 |
String |
Functional status code |
CLASSFP |
2 |
String |
Class code |
CHNG_TYPE |
2 |
String |
Type of area update |
EFF_DATE |
10 |
Date |
Effective date or vintage |
AUTHTYPE |
1 |
String |
Authorization type for legal area updates |
DOCU |
120 |
String |
Supporting documentation |
AREA |
10 |
Number |
Acreage of area update |
RELATE |
120 |
String |
Relationship description |
JUSTIFY |
150 |
String |
Justification |
NAME |
100 |
String |
Name |
VINTAGE |
2 |
String |
Vintage |
Table 40: Incorporated Places (place)
Attribute Field |
Length |
Type |
Description |
STATEFP |
2 |
String |
State code |
PLACEFP |
5 |
String |
Place code |
BASID |
11 |
String |
11-digit Boundary and Annexation Survey (BAS) ID |
NAMELSAD |
100 |
String |
Name with translated Local/Statistical Area Definition (LSAD) |
PLACENS |
8 |
String |
American National Standards Institute feature code for the county or equivalent area feature code for the place |
LSAD |
2 |
String |
Legal/Statistical Area Description code |
FUNCSTAT |
1 |
String |
Functional status code |
CLASSFP |
2 |
String |
Class code |
PARTFLG |
1 |
String |
Part flag indicator, indicates if only part of a feature is represented |
CHNG_TYPE |
2 |
String |
Type of area update |
EFF_DATE |
10 |
Date |
Effective date or vintage |
AUTHTYPE |
1 |
String |
Authorization type for legal area updates |
DOCU |
120 |
String |
Supporting documentation |
AREA |
10 |
Number |
Acreage of area update |
RELATE |
120 |
String |
Relationship description |
JUSTIFY |
150 |
String |
Justification |
NAME |
100 |
String |
Name |
VINTAGE |
2 |
String |
Vintage |
Table 41: Elementary School Districts (elsd)
Attribute Field |
Length |
Type |
Description |
STATEFP |
2 |
String |
State code |
SDLEA |
5 |
String |
School district local education agency code |
NAME |
100 |
String |
Base name portion of the standardized name |
LSAD |
2 |
String |
Legal/Statistical Area Description code |
LOGRADE |
2 |
String |
School district low grade |
HIGRADE |
2 |
String |
School district high grade |
PARTFLG |
1 |
String |
Part flag indicator, indicates if only part of a feature is represented |
SDTYP |
1 |
String |
Census Bureau school district type (e.g., A=Pseudo; B=Dept. of Defense; C=Interstate; D=Bureau of Indian Affairs; E=Same Name) |
POLYID |
4 |
String |
Record ID for each ELSD update |
CHNG_TYPE |
2 |
String |
Type of area update |
EFF_DATE |
10 |
Date |
Effective date or vintage |
RELATE |
120 |
String |
Relationship description |
JUSTIFY |
150 |
String |
Justification |
FUNCSTAT |
1 |
String |
Functional status code |
VINTAGE |
2 |
String |
Vintage |
Table 42: Secondary School Districts (scsd)
Attribute Field |
Length |
Type |
Description |
STATEFP |
2 |
String |
State code |
SDLEA |
5 |
String |
School district local education agency code |
NAME |
100 |
String |
Base name portion of the standardized name |
LSAD |
2 |
String |
Legal/Statistical Area Description code |
LOGRADE |
2 |
String |
School district low grade |
HIGRADE |
2 |
String |
School district high grade |
PARTFLG |
1 |
String |
Part flag indicator, indicates if only part of a feature is represented |
SDTYP |
1 |
String |
Census Bureau school district type (e.g., A=Pseudo; B=Dept. of Defense; C=Interstate; D=Bureau of Indian Affairs; E=Same Name) |
POLYID |
4 |
String |
Record ID for each SCSD update |
CHNG_TYPE |
2 |
String |
Type of area update |
EFF_DATE |
10 |
Date |
Effective date or vintage |
RELATE |
120 |
String |
Relationship description |
JUSTIFY |
150 |
String |
Justification |
FUNCSTAT |
1 |
String |
Functional status code |
VINTAGE |
2 |
String |
Table 43: School District Administrative Areas (sdadm)–Vermont only
Attribute Field |
Length |
Type |
Description |
STATEFP |
2 |
String |
State code |
SDLEA |
5 |
String |
School district local education agency code |
NAME |
100 |
String |
Base name portion of the standardized name |
LSAD |
2 |
String |
Legal/Statistical Area Description code |
LOGRADE |
2 |
String |
School district low grade |
HIGRADE |
2 |
String |
School district high grade |
PARTFLG |
1 |
String |
Part flag indicator, indicates if only part of a feature is represented |
SDTYP |
1 |
String |
Census Bureau school district type (e.g., A=Pseudo; B=Dept. of Defense; C=Interstate; D=Bureau of Indian Affairs; E=Same Name) |
POLYID |
4 |
String |
Record ID for each SDADM update |
CHNG_TYPE |
2 |
String |
Type of area update |
EFF_DATE |
10 |
Date |
Effective date or vintage |
RELATE |
120 |
String |
Relationship description |
JUSTIFY |
150 |
String |
Justification |
FUNCSTAT |
1 |
String |
Functional status code |
VINTAGE |
2 |
String |
Vintage |
Table 44: Unified School Districts (unsd)
Attribute Field |
Length |
Type |
Description |
STATEFP |
2 |
String |
State code |
SDLEA |
5 |
String |
School district local education agency code |
NAME |
100 |
String |
Base name portion of the standardized name |
LSAD |
2 |
String |
Legal/Statistical Area Description code |
LOGRADE |
2 |
String |
School district low grade |
HIGRADE |
2 |
String |
School district high grade |
PARTFLG |
1 |
String |
Part flag indicator, indicates if only part of a feature is represented |
SDTYP |
1 |
String |
Census Bureau school district type |
POLYID |
4 |
String |
Record ID for each UNSD update |
CHNG_TYPE |
2 |
String |
Type of area update |
EFF_DATE |
10 |
Date |
Effective date or vintage |
RELATE |
120 |
String |
Relationship description |
JUSTIFY |
150 |
String |
Justification |
FUNCSTAT |
1 |
String |
Functional status code |
VINTAGE |
2 |
String |
Table 45: Area Landmark (arealm)
Attribute Field |
Length |
Type |
Description |
STATEFP |
2 |
String |
State code |
COUNTYFP |
3 |
String |
County code |
MTFCC |
5 |
String |
MAF/TIGER Feature Class Code |
FULLNAME |
120 |
String |
Complete name associated with the area landmark |
AREAID |
22 |
String |
Landmark identification number, or Object ID |
ANSICODE |
8 |
String |
American National Standards Institute feature code for the county or equivalent area feature code for the area landmark |
PARTFLG |
1 |
String |
Part flag indicator, indicates if only part of a feature is represented |
CHNG_TYPE |
2 |
String |
Type of area update |
EFF_DATE |
10 |
Date |
Effective date or vintage |
RELATE |
120 |
String |
Relationship description |
JUSTIFY |
150 |
String |
Justification |
BAG |
3 |
String |
Block area grouping |
Attribute Field |
Length |
Type |
Description |
STATEFP |
2 |
String |
State code |
COUNTYFP |
3 |
String |
County code |
TLID |
10 |
Number |
Permanent Edge ID |
TFIDL |
10 |
Number |
Permanent Face (Topological Polygon) ID on the left |
TFIDR |
10 |
Number |
Permanent Face (Topological Polygon) ID on the right |
MTFCC |
5 |
String |
MAF/TIGER Feature Class Code |
FIDELITY |
1 |
String |
Flag indicating whether boundary edge has changed through spatial enhancement |
FULLNAME |
40 |
String |
Complete name associated with the edge includes abbreviated qualifier, direction, and feature type |
SMID |
22 |
Number |
Spatial metadata ID |
SMIDTYPE |
1 |
String |
Source attribution for boundary edge: PLSS, Parcel, Surveyed, etc. |
RTTYPE |
1 |
String |
Route type code |
BBSPFLG |
1 |
String |
Indicates Redistricting Data Project participant’s request to flag an edge for selection to hold as boundary for a tabulation block |
CBBFLG |
1 |
String |
Indicates the status of an edge for selection as tabulation block boundary |
BBSP_2030 |
1 |
String |
New BBSP flag |
CHNG_TYPE |
4 |
String |
Type of linear feature update |
JUSTIFY |
150 |
String |
Justification |
LTOADD |
10 |
String |
Left to address |
RTOADD |
10 |
String |
Right to address |
LFROMADD |
10 |
String |
Left from address |
RFROMADD |
10 |
String |
Right from address |
ZIPL |
5 |
String |
Left from ZIP Code |
ZIPR |
5 |
String |
Right from ZIP Code |
EXTTYP |
1 |
String |
Extension type |
MTUPDATE |
10 |
Date |
Date of the last update to the edge |
Attribute Field |
Length |
Type |
Description |
TFID |
20 |
Number |
Permanent Face (Topological Polygon) ID |
STATEFP |
2 |
String |
State code |
COUNTYFP |
3 |
String |
County code |
TRIBSUBCE |
3 |
String |
Census Bureau tribal subdivision code |
TTRACTCE |
6 |
String |
Tribal census tract code |
TBLKGRPCE |
1 |
String |
Tribal census block group code |
AIANNHCE |
4 |
String |
Census Bureau American Indian, Alaska Native, or Native Hawaiian (AIANNH) area code |
AIANNHCE20 |
4 |
String |
2020 Census AIANNH area code |
COMPTYP |
1 |
String |
Indicates if record is reservation (or equivalent) or off-reservation trust land portion of AIANNH area |
ANRCFP |
5 |
String |
Alaska Native Regional Corporation (ANRC) code |
SLDUST |
3 |
String |
State Legislative District (SLD) upper chamber code |
SLDLST |
3 |
String |
SLD lower chamber code |
ELSD |
5 |
String |
Current elementary school district SDLEA code |
SCSD |
5 |
String |
Current secondary school district SDLEA code |
UNSD |
5 |
String |
Current unified school district SDLEA code |
SDADM |
5 |
String |
Current school district administrative area code |
CDFP |
2 |
String |
Congressional district code |
TRACTCE |
6 |
String |
Census tract code |
UACE |
5 |
String |
Census Bureau urban area code |
CBSAFP |
5 |
String |
Core based statistical area code |
BLKGRPCE |
1 |
String |
Census block group code |
BLOCKCE |
4 |
String |
Tabulation block code |
SUFFIX1CE |
2 |
String |
Census block suffix 1 |
SUFFIX2CE |
2 |
String |
Census block suffix 2 |
BAGCE |
3 |
String |
Block area grouping |
PUMACE20 |
5 |
String |
Public use microdata area code from 2020 |
SUBMCDFP |
5 |
String |
Sub-minor civil division code |
UGACE |
5 |
String |
Urban growth area code |
STATEFP20 |
2 |
String |
State code from 2020 |
COUNTYFP20 |
3 |
String |
County code from 2020 |
TRACTCE20 |
6 |
String |
Census tract code from 2020 |
PLACEFP |
5 |
String |
Place code |
COUSUBFP |
5 |
String |
County subdivision code |
CONCITYFP |
5 |
String |
Consolidated city code |
CDSESSN |
3 |
String |
Congressional district session code |
LWFLG |
1 |
String |
Land/water flag |
Table 48: Hydrography–Area (water)
Attribute Field |
Length |
Type |
Description |
STATEFP |
2 |
String |
State code |
COUNTYFP |
3 |
String |
County code |
ANSICODE |
100 |
String |
American National Standards Institute feature code for the county or equivalent area code for hydrography area |
MTFCC |
8 |
String |
MAF/TIGER Feature Class Code |
FULLNAME |
2 |
String |
Complete name associated with the water feature |
CHNG_TYPE |
2 |
String |
Type of area update |
HYDROID |
22 |
String |
Object ID |
RELATE |
120 |
String |
Relationship description |
JUSTIFY |
150 |
String |
The Census Bureau recommends the use of the QGIS documentation to supplement information provided within this appendix. Refer to the QGIS documentation guide on-screen or download an Adobe Acrobat PDF of the QGIS 3.34.3 documentation from the following link <https://docs.qgis.org/3.34/en/docs/user_manual/>.
Note: The QGIS 3.34.3 documentation is in the “Archived” section at the bottom of the previously listed link.
The Menu bar, the Standard toolbar, and the SDRP toolbar (Figure 35) are located at the top of the GUPS page. These toolbars offer general GIS and system tools used to make SDRP updates. Chapter 5 covers the SDRP toolbar and its functionality.

Figure 35: Menu Bar, Standard Toolbar, and SDRP Toolbar
Note: Although the Menu bar is always located at the top of the page and cannot be moved, the Standard and SDRP toolbars can be moved to different positions and resized depending on user preferences.
Hovering over a toolbar button will display a tooltip that provides a name for that tool. The sub-appendices describe the Menu bar, the Standard toolbar, Table of Contents and its toolbar, and the Status bar.
The Menu bar includes top-level, drop-down menus and allows navigation through GUPS using a standard hierarchical menu. Most relate to QGIS functionality and not GUPS functionality. The Menu bar, shown in Figure 36 offers basic features to manage the Map View. Almost all the functions available from the Menu bar are also available in the various toolbars.
![]()
Table 49 defines each of the tabs on the Menu bar, provides an image of the drop-down options for each, and describes each tab’s function.
Table 49: Menu Bar Tabs and Their Function/Description
Menu |
Menu Option(s) |
Function/Description |
Project |
|
Provides access and exit points of the project file. |
Edit |
|
Provides most of the native tools to edit layer attributes or geometry. From the Edit tab, select Undo to undo the last action or Redo the action. Note: The correct layer must be selected first from the Table of Contents for the edit to work properly. For example, if a linear feature is added to the Edges layer, then that layer is deselected by selecting the faces layer, Undo will not delete the linear feature. The Edges layer must be selected to undo the added linear feature. Note: Multiple actions can be undone on a single layer (e.g., the addition of several linear features) if the project has not been saved. If the project is saved, the Undo option is disabled. |
View |
|
Provides options for navigating the map, identifying feature attributes, and creating spatial bookmarks. |
Layer |
|
Provides large set of tools to create new data sources, add them to a project, or save modifications to them. |
Settings |
|
Provides tools and options to manage profiles, styles, projections, and interfaces of the project. |
Vector |
|
Provides access to QGIS Geoprocessing Tools. These tools include buffers, area overlay operations such as intersection, union, or symmetrical difference, as well as other common geoprocessing actions. |
Raster |
|
Provides common raster-based GIS tasks from different providers. |
Processing |
|
Provides access to other non-GUPS functionality such as model creation, viewing the results of models executed, and history. |
Help |
|
Provides common help functions for understanding QGIS. |
GUPS |
|
Provides information about GUPS version (About GUPS) and shortcuts to other common GUPS related toolbars. The About GUPS sub-menu provides the GUPS version number. Callers to technical support need to provide the version number with their question. |
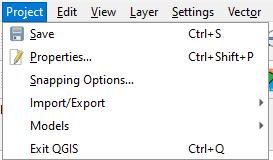
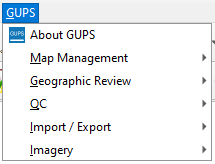
The Standard toolbar, shown in Figure 37 provides the navigation tools to interact with the map and layers attribute tables.
![]()
The Standard toolbar includes three sub-toolbars, identified by the grouping bars or markers on the toolbar. See Figure 38 for a visual of the markers.
![]()
Figure 38: Sub-Toolbar Markers
The first sub-toolbar, the Project toolbar, contains buttons for saving projects, changing map projects, and managing map projects. The second sub-toolbar, the Map Navigation toolbar, contains buttons to navigate the Map View. The last sub-toolbar, the Attributes toolbar, contains buttons to identify, select, and measure elements within the map. To rearrange the toolbars, press the left mouse button and hold the sub-toolbar marker then drag it to the desired location within the project. Release the mouse button to set the toolbar in the new location.
Table 50 provides a visual of each button, the corresponding name, and each button’s function/description.
Table 50: Standard Toolbar Buttons and Their Function/Description
Button |
Name |
Function/Description |
|
Save |
Saves the current GUPS project, including any changes to layer properties, projection, last viewed extent, and layers added. |
|
Style Manager |
Opens interface that manages symbols, color ramps, texts formats or label settings. |
|
Map Management |
Provides access to the geographic partnership programs in GUPS. Map management automatically loads default map display layers based on the program chosen. |
|
GUPS Data Settings |
Opens window to change the GUPS working directory should problems occur when loading data. Also allows for deletion of a program or a project. Warning! This tool deletes files and folders permanently! Contact the SDRP team if any doubts exist prior to executing this tool. For more information see the sub-appendices E2.1 and E2.2. |
|
Import Custom Shapefiles |
Imports user provided shapefiles to existing project and converts the shapefile(s) to match the project spatial reference, if needed. See sub-appendix E2.3. |
|
Pan Map |
Shifts the map in the Map View without changing the map scale. Select the button and then choose a location on the map to re-center the map to the location. |
|
Pan Map to Selection |
Shifts the map in the Map View to the rows selected in the attribute table for a selected feature. After selecting a feature(s), select the button to re-center the map based on the selected feature(s). |
|
Zoom In |
Increases the map scale after selecting the Map View and displays the Map View at a larger scale. Select the button and then choose a location on the map to zoom into. |
|
Zoom Out |
Decreases the map scale after selecting the Map View and displays the Map View at a smaller scale. Select the button and then choose a location on the map to zoom out from. |
|
Zoom Full |
Displays the map in the Map View at a smaller scale and zooms to the full extent of the project. |
|
Zoom to Selection |
Zooms to the scale of the feature selected in the Map View or attribute table. |
|
Zoom to Layer |
Zooms the Map View to the layer selected in the Table of Contents. After selecting the layer, select the button to zoom to the layer’s extent. |
|
Zoom Last |
Zooms the Map View to the previous map extent. |
|
Zoom Next |
Zooms the Map View forward to the next map extent (only if a previous extent is available.) |
|
New Bookmark |
Creates a spatial bookmark for the given area to ease navigation. Allows for the naming and saving of the geographic location for future reference. |
|
Show Bookmarks |
Views and manages spatial bookmarks. Use the mouse to double-click bookmark name in the Spatial Bookmark window to zoom to the bookmark. |
|
Refresh |
Refreshes Map View at the current extent. |
|
Identify Features |
Identifies geographic features in the Map View.
Left-click on a feature to identify attributes for a selected layer in the Table of Contents. Right-click on the map to identify attributes for all visible layers at that selection point. |
|
Select Features by Area or Single Click |
Provides options to select layer features in the map window with a single click, by dragging the cursor, or by drawing graphics on the screen. |
|
Select Features by Value |
Provides options to select features by value or expression, as well as select all features or invert existing feature selection. |
|
Deselect Features from All Layers |
Deselects selected features from all layers in a single action. |
|
Toolbox |
Reveals a Processing Toolbox window with numerous QGIS processing tasks. |
|
Measure |
Provides options to measure linear distance, area, and angles on the map. |
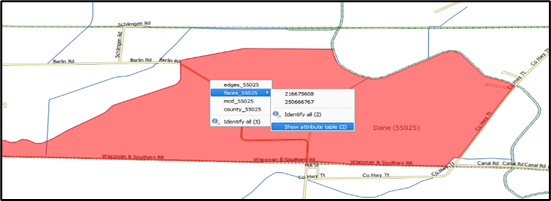
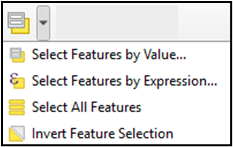
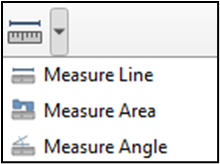
When installing GUPS, the working directory, or GUPSGIS folder, is saved by default in the home directory (typically this is the My Documents folder) unless the user specifies a different path. To change the location of the working directory after GUPS has been installed, use the Change Folder button in the GUPS Data Settings tool as described in Table 51.
Note: All projects must be closed to change the working directory. If a project is open in GUPS, the Change Folder button is not active.
Table 51: Steps to Change the Working Directory
Step |
Action and Result |
Step 1 |
After choosing the GUPS Data Settings button, the GUPS Data Settings window appears. Select the Change Folder button along the upper right side of the window.
A notification appears asking the user to check that there are no custom layers in the project. Custom layers are any data in the project that is stored outside the GUPSGIS data folder, for example, a reference shapefile. Only layers stored in the GUPSGIS folder are copied through this action. Select OK.
|
Step 2 |
The next screen to appear is the Select Directory window. From this screen choose the location for the new working directory. In this example, the Documents folder is chosen as the new location for the GUPSGIS data folder. Choose the Select button to continue.
|
Step 3 |
Once all files have been copied, GUPS displays a final notification that the move was successful and that GUPS must be restarted.
|
Step 4 |
To confirm that the working directory has been changed, open the GUPS Data Settings tool and check the folder location that appears for the GUPS Home, Data Location, and Log Location fields.
|
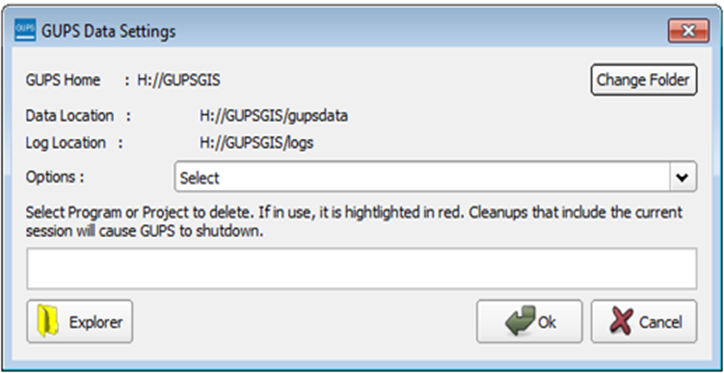
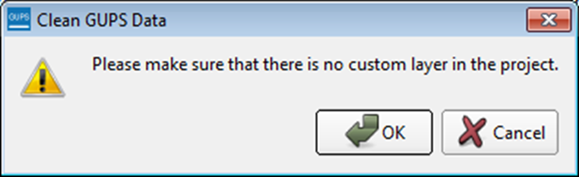
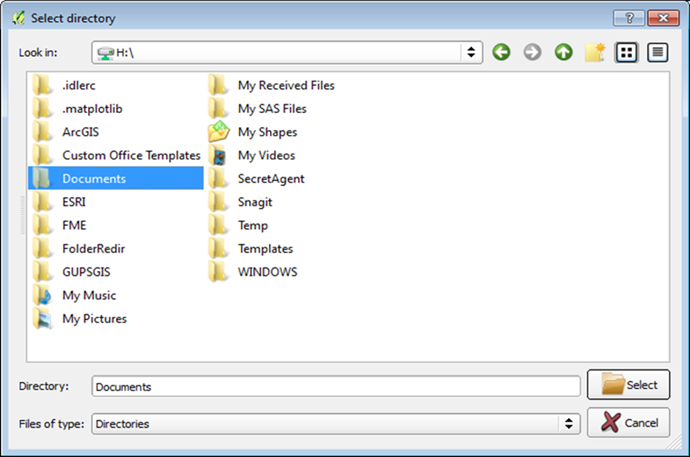
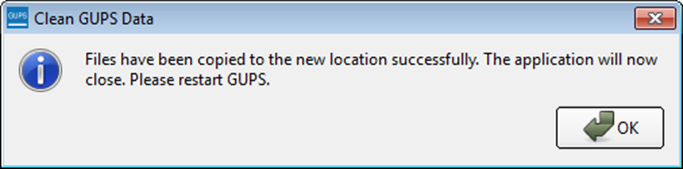
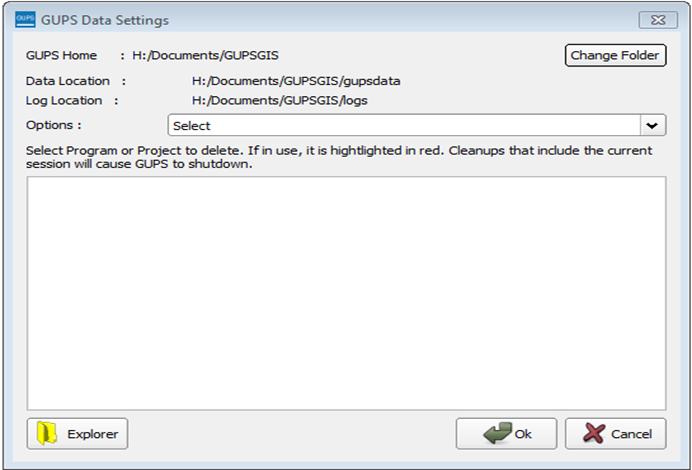
The GUPS Data Settings tool (Figure 39) offers three clean data options: Clean by Project, Clean by Program, and Clean All GUPS Data.
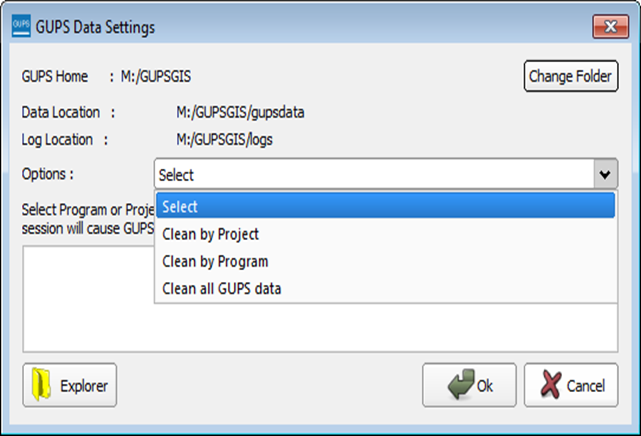
Figure 39: GUPS Data Settings Window
The Clean by Project (Figure 40) option allows the user to delete data/files per project. This can be useful if there is a single project that is no longer needed, or the user would like to restart the project with the original Census Bureau data. The red dotted highlighted item indicates a project that is currently in use in GUPS. To delete a project, select the checkbox next to the project then select Ok. To ensure that all data and files have been deleted, restart QGIS/GUPS by closing the program and reopening it again.
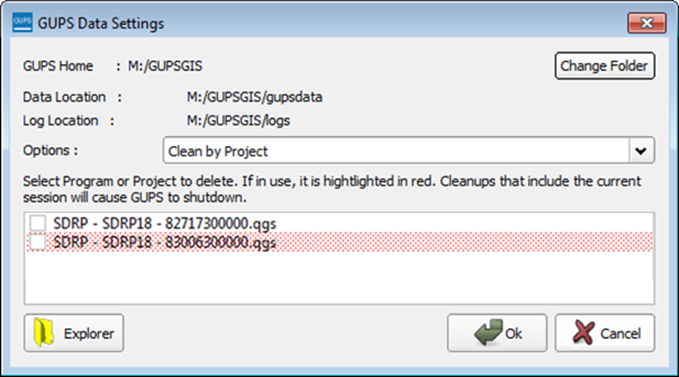
Figure 40: GUPS Data Settings–Clean by Project
In order to delete all projects associated with a certain program, use the Clean by Program option (Figure 41). To ensure that all data and files associated with a program are removed, restart QGIS/GUPS by closing the program and reopening it again.
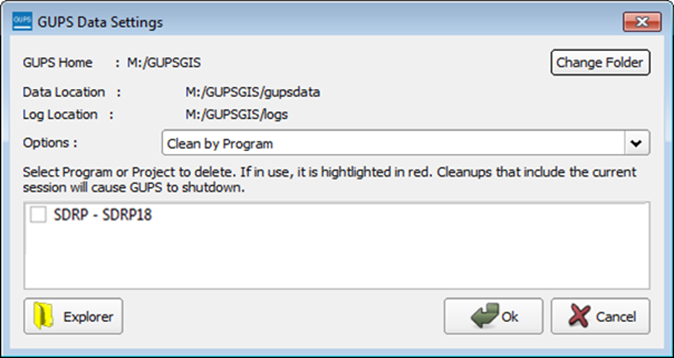
Figure 41: GUPS Data Settings–Clean by Program
The final option is to Clean All GUPS Data. As the name implies, this deletes all GUPS data located in the GUPSGIS data folder in the home directory. This permanently deletes all files and folders, so once the tool has finished, files and folders cannot be recovered. GUPS should automatically restart once this clean completes. If GUPS does not automatically restart, manually restart GUPS to ensure that all data has been deleted. No figure is included to illustrate this action.
GUPS is a full GIS software. It provides all the standard GIS software capabilities including importing user data. To access the full list of possible user files to import, select Layer from the Menu bar, then select the sub-menu Add Layer. GUPS also provides a custom tool to import shapefiles and convert the spatial reference if necessary. Follow the steps in Table 52 to add a shapefile using the Import Custom Shapefile button on the Standard toolbar.
Table 52: Steps to Import Custom Shapefiles
Step |
Action and Result |
Step 1 |
From the Standard toolbar, select the Import Custom Shapefile button.
|
Step 2 |
A file browser window opens. Browse to the location of the shapefile to import. Select the shapefile and then select Open.
|
Step 3 |
If the selected shapefile has a projection that differs from the default projection set for the project (NAD83), the tool will display a notification indicating that a difference in projection has been found. Select Change Projection to convert the imported shapefile to match the NAD83 projection set for the project and add the layer to the project. Select Cancel to cancel the import and close the tool.
|
Step 4 |
Participants modify the properties of the layer by selecting the layer in the Table of Contents and using the right mouse button to open Properties for the layer.
|
Step 5 |
The Layer Properties window opens. Modifications can be made to various default properties set for the added layer.
Participants may also “drag and drop” the layer into a different location within the Table of Contents to change the placement of the layer within the project. |
|
Imported shapefiles are added to the project folder located in the GUPSGIS home directory. The GUPSGIS home directory is typically located in the My Documents folder. These imported shapefiles will be included as part of the Zip file created using the Share with Another Participant export (see sub-section 5.5.1; however, imported shapefiles will not be included when exporting a file for submission to the Census Bureau. |
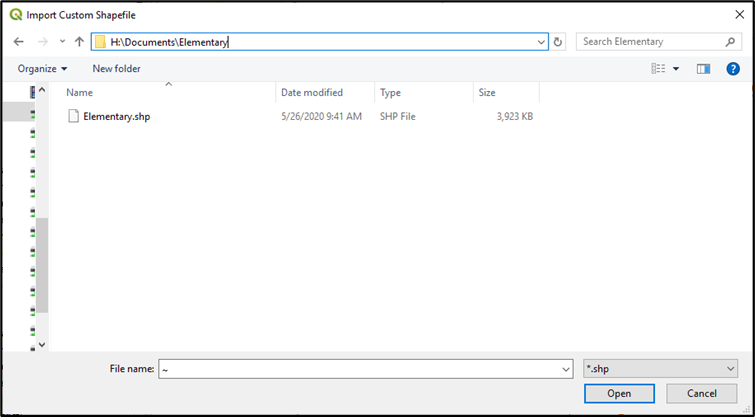

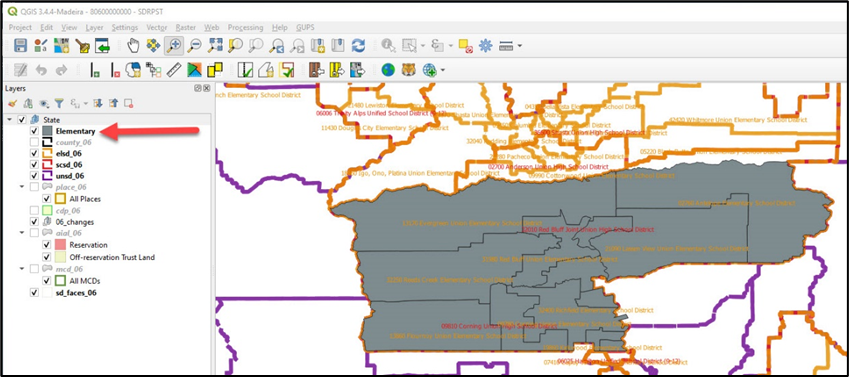
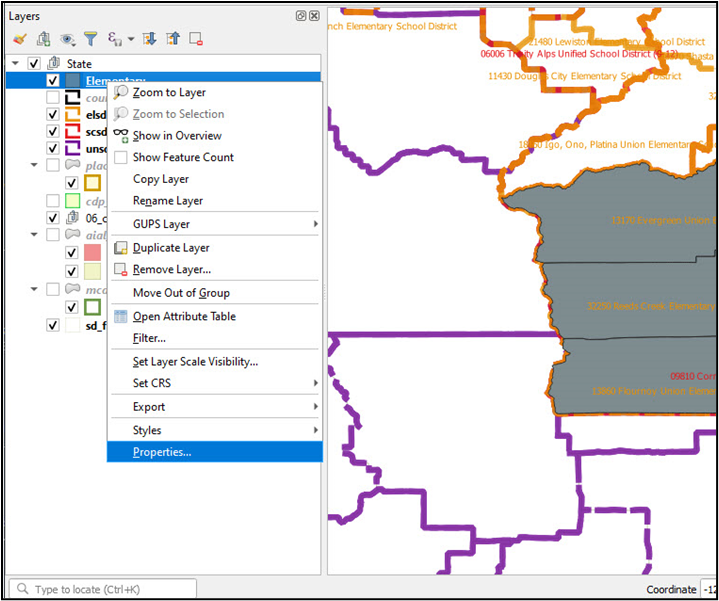
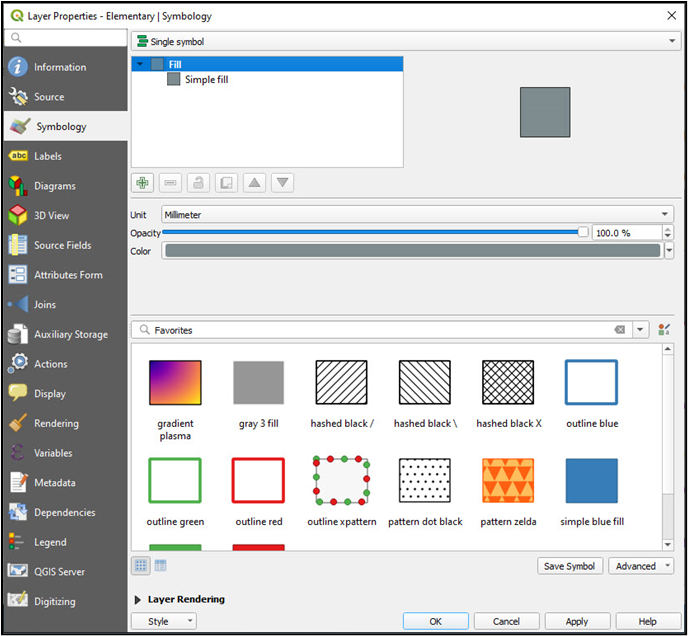
GUPS automatically loads a set of default data layers (and default layer groups) defined by the Census Bureau for the SDRP. As the map opens in Map View, the list of the preset, grouped layers appears in the Table of Contents. Participants may use the Table of Contents and Table of Contents toolbar to manage the Map View. See Figure 42 for a visual of the Table of Contents toolbar.
Using the Table of Contents toolbar, users can add and remove layers or groups, manage map themes, filter the legend by map content or by expression, expand or collapse all sections of the Table of Contents list at once and may remove layers/groups. Users may manipulate layers and symbology in GUPS using basic selection/deselection techniques in the Table of Contents, like with other GIS software. Manipulation of layers within the Table of Contents may assist with viewing information more appropriately in the Map View. Changes made in the Table of Contents reflect immediately in the Map View.
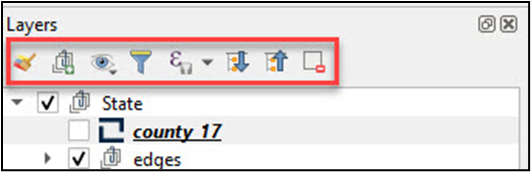
Figure 42: Table of Contents Toolbar
Table 53 provides a visual of each button, the corresponding name, and each button’s function/description.
Table 53: Table of Contents Toolbar Buttons and Their Function/Description
Button |
Name |
Function/Description |
|
Open Layer Styling Panel |
Toggles layer styling panel on/off. |
|
Add Group |
Organizes layers in the Table of Contents into groups. |
|
Manage Map Themes |
Offers modification of views based on layers in the Table of Contents. |
|
Filter Legend by Map Content |
Removes layers not currently in the Map View extent. |
|
Filter Legend by Expression |
Removes features from the selected layer tree style that have no features satisfying a condition/expression. |
|
Expand All |
Expands the Table of Contents menus to display all layers under each group’s menu. |
|
Collapse All |
Collapses the Table of Contents menus to only show groups (not the layers beneath.) |
|
Remove Layer/Group |
Removes a layer or group from the Table of Contents. |
To manage visibility of individual groups or layers, check the checkbox next to a layer to make the layer visible (e.g., turn the layer on) in the Map View. Uncheck the checkbox (e.g., turn the layer off) next to a layer to make the layer invisible in the Map View. This may prove beneficial if the Map View is cluttered with too many data layers.
To expand the menu
for a layer or grouped layer, select the
![]() symbol and the sub-menu opens. Select the
symbol and the sub-menu opens. Select the
![]() symbol to collapse the sub-menu. See Figure 43
for an example of the checkmark and arrow symbology.
symbol to collapse the sub-menu. See Figure 43
for an example of the checkmark and arrow symbology.
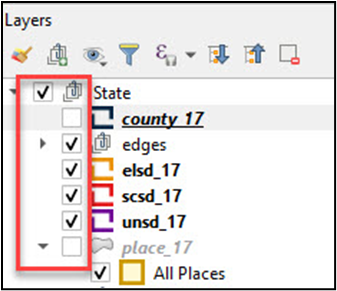
Figure 43: Table of Contents with Layer Checkmarks and Arrows
The order in which the layers appear in the Table of Contents determines the order that the layers display in the Map View. The layers at the top of the Table of Contents display on top of the layers that appear below them. While SDRP GUPS is programmed to display data layers in an order that works for most users, adding imagery or other data layers may require a reordering of layers for the map elements to appear properly within GUPS. To manage the order of layers, use the mouse and follow these steps:
Select the layer name in the Table of Contents.
Hold down the mouse button and drag the layer to the desired position in the Table of Contents.
Release the mouse button to place the layer in its new position. The Map View will reflect the new layer order in the Table of Contents.
IMPORTANT: Map labels appear at varying scales dependent on the map layer.
The Status bar (Figure 44) at the bottom of the GUPS main page displays information about the map from the current map scale to mouse cursor coordinates.
![]()
Table 54 describes each element of the Status bar.
Table 54: Status Bar Elements and Their Function/Description
Element |
Function/Description |
|
This locator bar, a quick search widget, helps find and run any feature or option in QGIS. |
Coordinate |
Shows the current position in map coordinates as the mouse moves across the Map View. The default unit shown is decimal degrees. |
|
Toggles between the coordinate position of the mouse cursor or the Map View extents as the map is panned and zoomed. |
Scale |
Shows the ratio between the distance on the map and distance on the ground based on current map units. |
|
Lock the scale to use the magnifier to zoom in and out. |
Magnifier |
Defines current magnification level for the Map View. Allows user to zoom without changing the scale in the Map View, making it easier to tweak label positions and symbols. Magnification is as percentage. If 100%, then magnification is not applied to the view. |
Rotation |
Defines the clockwise rotation for the Map View in degrees. |
|
Temporarily prevent layers from drawing. Enable by selecting the checkbox immediately to the left of “Render”. |
|
Shows the current coordinate reference system used in the Map View. |
|
Shows the logs for the GUPS session. The logs include information about underlying processes related to QGIS startup, plugins loading, processing tools, etc. |
1 Refer to Appendix B for additional information.

![]()
| File Type | application/vnd.openxmlformats-officedocument.wordprocessingml.document |
| File Title | 2026SDRP_RespondentGuide__ApprovedbyMgmt |
| Author | U.S. Census Bureau |
| File Modified | 0000-00-00 |
| File Created | 2025-08-12 |
© 2026 OMB.report | Privacy Policy