Burden Table
Appendix D1 Estimates of Respondent Burden OMHA (1).xlsx
OMHA Annual Appellant Climate Survey
Burden Table
OMB: 0990-0330
Document [xlsx]
Download: xlsx | pdf
Annualized Cost to Respond
BLS Wages
Stratification

Overview
Burden TableAnnualized Cost to Respond
BLS Wages
Stratification
Sheet 1: Burden Table
| Respondent Type | Form Name | Number of Respondents | Number of Responses Per Respondent | Burden Per Response (Hours) | Total Burden (Hours) | |
| Individuals or Households | Beneficiaries | B1-B6; C1-C8 | 400 | 1 | 15/60 | 100 |
| Individuals or Households | Non-Beneficiaries | 400 | 1 | 15/60 | 100 | |
| Total | 800 | 1 | 15/60 | 200 | ||
| Total annual burden estimates (including participants and non-respondents) | 200 | |||||
| Total # of respondents (including participants and non-respondents) | 800 | |||||
| KEY: | Appellant Climate Survey-English/Spanish | 14 min | ||||
| call, answer | 3 min | |||||
| voicemail | <1 min | |||||
| mail, read | 1.2 min | |||||
| mail, don't read | 0 min | |||||
| mail back | 3 min | |||||
Sheet 2: Annualized Cost to Respond
| Respondent Type | Form Name | Total Burden (Hours) | Hourly Wage | Cost to Respondent |
| Beneficiaries | B1; B2; C1; C2; C3; C4; C5; C6 | 100 | $21.09 | $2,109.00 |
| Non-Beneficiaries | 100 | $36.69 | $3,669.00 | |
| Total | 200 | $5,778.00 | ||
Sheet 3: BLS Wages
| Year | area | area_title | area_type | naics | naics_title | own_code | occ code | occ title | group | tot_emp | emp_prse | jobs_1000 | loc_quotient | pct_total | h_mean | a_mean | mean_prse | h_pct10 | h_pct25 | h_median | h_pct75 | h_pct90 | a_pct10 | a_pct25 | a_median | a_pct75 | a_pct90 | annual | hourly | ||||
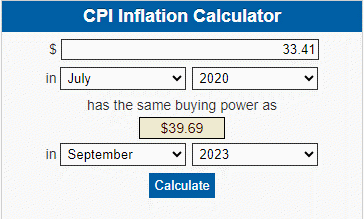
| Beneficiaries | $21.09 | 
|
Sep 2021 | The Consumer Price Index for All Urban Consumers (CPI-U) increased 0.4 percent in September on a seasonally adjusted basis after rising 0.3 percent in August, the U.S. Bureau of Labor Statistics reported today. Over the last 12 months, the all items index increased 5.4 percent before seasonal adjustment. | |||||||||||||||||||||||||||||
| Sep 2022 | The Consumer Price Index for All Urban Consumers (CPI-U) rose 0.4 percent in September on a seasonally adjusted basis after rising 0.1 percent in August, the U.S. Bureau of Labor Statistics reported today. Over the last 12 months, the all items index increased 8.2 percent before seasonal adjustment. | ||||||||||||||||||||||||||||||||
| Sep 2023 | The Consumer Price Index for All Urban Consumers (CPI-U) rose 0.4 percent in September on a seasonally adjusted basis, after increasing 0.6 percent in August, the U.S. Bureau of Labor Statistics reported today. Over the last 12 months, the all items index increased 3.7 percent before seasonal adjustment. | ||||||||||||||||||||||||||||||||
| Non-Beneficiaries | Providers/Suppliers | $39.69 | Sep 2021 | The Consumer Price Index for All Urban Consumers (CPI-U) increased 0.4 percent in September on a seasonally adjusted basis after rising 0.3 percent in August, the U.S. Bureau of Labor Statistics reported today. Over the last 12 months, the all items index increased 5.4 percent before seasonal adjustment. | |||||||||||||||||||||||||||||
| Sep 2022 | The Consumer Price Index for All Urban Consumers (CPI-U) rose 0.4 percent in September on a seasonally adjusted basis after rising 0.1 percent in August, the U.S. Bureau of Labor Statistics reported today. Over the last 12 months, the all items index increased 8.2 percent before seasonal adjustment. | ||||||||||||||||||||||||||||||||
| Sep 2023 | The Consumer Price Index for All Urban Consumers (CPI-U) rose 0.4 percent in September on a seasonally adjusted basis, after increasing 0.6 percent in August, the U.S. Bureau of Labor Statistics reported today. Over the last 12 months, the all items index increased 3.7 percent before seasonal adjustment. | ||||||||||||||||||||||||||||||||
| Sources: | |||||||||||||||||||||||||||||||||
| https://www.bls.gov/data/inflation_calculator.htm | |||||||||||||||||||||||||||||||||
| https://www.bls.gov/bls/news-release/cpi.htm | |||||||||||||||||||||||||||||||||
| https://data.bls.gov/timeseries/CUUR0000SA0 |

Sheet 4: Stratification
| Stratification Groups | Expected Volume of Claims | Estimated Sample Counts |
| Beneficiary Status | ||
| Beneficiary | 500 | |
| Non-beneficiary | 500 | |
| Total | 1000 | |
| Stratification Groups | Expected Volume of Claims | Estimated Survey Counts |
| Beneficiary Status | ||
| Beneficiary | 400 | |
| Non-beneficiary | 400 | |
| Total | 800 |
| File Type | application/vnd.openxmlformats-officedocument.spreadsheetml.sheet |
| File Modified | 0000-00-00 |
| File Created | 0000-00-00 |
© 2026 OMB.report | Privacy Policy