Cover Letter and Report of Findings
Attachment 3_Cover letter & report of findings_2024OCT01.docx
Developmental Projects to Improve the National Health and Nutrition Examination Survey and Similar Programs
Cover Letter and Report of Findings
OMB: 0920-1208
Attachment 3. Cover letter and Report of Findings
Dear <<Volunteer>>,
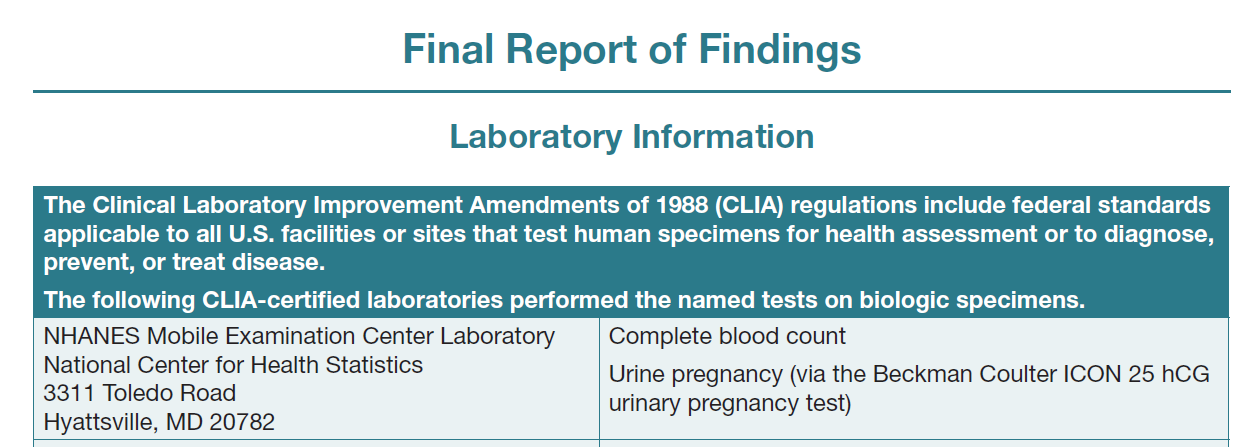
Thank you for taking part in a Dual Energy X-Ray Absorptiometry study and a Hematology Analyzer plus Serum Blood Tube Comparison study at the Centers for Disease Control and Prevention’s National Health and Nutrition Examination Survey (NHANES) Mobile Examination Center.
We are providing some of the test results to you, but it is important to know that results are intended to validate and compare laboratory and medical equipment and should not be used to make any clinical diagnoses. Interpretation of these results must be made by an appropriately licensed healthcare provider.
You can choose to share them with your health care providers. If you do so, they may recommend other tests that may or may not identify a health concern. The follow up process may cause some people to feel nervous, and rarely, the recommended additional testing may be associated with other risks. You will be responsible for any costs associated with these additional tests.
You are responsible for securing your test results. If you do not want anyone else to see your results, keep them secure so no one else can review them. We will not report your results to health care providers or public health departments.
If you have any questions about your results or need help locating a medical provider in your area, you can reach me Monday through Friday from 9am to 5pm Eastern Time, toll-free, at 1-800-452-6115 (press 1 for English and press 2 for Spanish).
Sincerely,
Duong Nguyen, DO
Captain, U.S. Public Health Service
Chief Medical Officer
Division of Health and Nutrition Examination Surveys
National Center for Health Statistics
Centers for Disease Control and Prevention
Enclosure 12345
{OMB NUMBER}
{OMB EXP DATE}
NOTE: These results are intended to validate and compare laboratory and medical equipment and should not be used to make any clinical diagnoses. Interpretation of these results must be made by an appropriately licensed healthcare provider.
DXA Crossover Study Results

The DXA test cannot be conducted on pregnant people. You may have submitted a urine sample for pregnancy testing. The result of your pregnancy test today is:
o Negative
o Positive
o Age not applicable (woman of non-childbearing age)
The DXA test is not a complete examination and not intended to be a substitute for tests ordered by your doctor. However, the report below contains the results of your tests and may be useful to you or your doctor.
Whole body scan
This test provides information on the percentage of body fat.
Your total body fat is ____%.
We do not know what percentage of body fat is healthy for your age and gender. Researchers are working to define healthy ranges. Too much body fat (or a high percentage) may increase a person's risk of having diabetes or heart disease.
Bone density test
The bone density measurement can help spot people who may be at a greater risk for fracture because they have weaker bones. In general, a lower bone density measurement means that the bone is weaker. Yet not all people with lower bone density will have fractures.
1. The result from your hip (left or right) scan show:
Hip bone density ____g/cm2
T-Score ____
Based on diagnostic criteria as recommended by the World Health Organization and the International Society of Clinical Densitometry, your hip bone density is:
o Normal
DXA Crossover Study Results, continued
o Low (Most people develop low bone density over many years. We recommend you discuss this result with your doctor. Your doctor can review your diet and lifestyle and recommend ways to prevent further bone loss.)
o Very low (Discuss this result with your doctor as soon as possible. Fractures due to osteoporosis often occur at sites with very low bone density. Your doctor can review your diet and lifestyle and recommend ways to prevent further bone loss or fractures.)
2. The results from your lumbar spine (lower back) scan show:
Spine bone density ____g/cm2
T-Score ____
Based on diagnostic criteria as recommended by the World Health Organization and the International Society of Clinical Densitometry, your spine bone density is:
o Normal
o Low (Most people develop low bone density over many years. We recommend you discuss this result with your doctor. Your doctor can review your diet and lifestyle and recommend ways to prevent further bone loss.)
o Very low (Discuss this result with your doctor as soon as possible. Fractures due to osteoporosis often occur at sites with very low bone density. Your doctor can review your diet and lifestyle and recommend ways to prevent further bone loss or fractures.)
NOTE: These results are intended to validate and compare laboratory and medical equipment and should not be used to make any clinical diagnoses. Interpretation of these results must be made by an appropriately licensed healthcare provider.
Hematology Crossover Study Results
Complete Blood Count |
Result |
Units |
Reference |
White blood count |
XX.X |
(x103/uL) |
|
Lymphocytes |
XX.X |
(%) |
|
Lymphocytes |
X.X |
(x109/L) |
|
Monocytes |
X.X |
(%) |
|
Monocytes |
X.X |
(x109/L) |
|
Neutrophils |
X.X |
(%) |
|
Neutrophils |
XX.X |
(x109/L) |
|
Eosinophils |
X.X |
(%) |
|
Eosinophils |
X.X |
(x109/L) |
|
Basophils |
X.X |
(%) |
|
Basophils |
X.X |
(x109/L) |
|
Red blood count |
X.X |
(x106/uL) |
|
Hemoglobin |
XX.X |
(g/dL) |
|
Hematocrit |
XX.X |
(%) |
|
Mean Cell Volume (MCV) |
XX.X |
(fL) |
|
Mean Cell Hemoglobin (MCH) |
XX.X |
(pg) |
|
MCHC |
XX.X |
(g/dL) |
|
RDW |
XX.X |
(%) |
|
Platelet Count |
X.X |
(x109/L) |
|
Mean Platelet Volume (MPV) |
X.X |
(fL) |
|
--- Test not done |
|
|
|
All CBC reports will contain the following: This finding was not confirmed by microscopy.
Reference Ranges Males
Complete Blood Count |
18 years of age |
19-65 years of age |
66+ years of age
|
White Blood Cell Count |
3.6-11.5 |
3.9-11.8 |
3.8-12.1 |
Lymphocytes (%) |
17.5-54.3 |
16.1-47.9 |
12.3-46.4 |
Lymphocytes (#) |
0.6-6.2 |
0.6-5.7 |
0.5-5.6 |
Monocytes (%) |
4.8-13.7 |
4.4-13.5 |
4.6-14.0 |
Monocytes (#) |
0.2-1.6 |
0.0-1.6 |
0.2-1.7 |
Neutrophils (%) |
30.3-72.8 |
37.8-74.6 |
39.5-78.1 |
Neutrophils (#) |
1.1-8.4 |
1.5-8.8 |
1.5-9.5 |
Eosinophils (%) |
0.7-11.5 |
0.7-8.5 |
0.6-8.8 |
Eosinophils (#) |
0.0-1.3 |
0.0-1.0 |
0.0-1.1 |
Basophils (%) |
0.1-1.6 |
0.1-1.6 |
0.1-1.6 |
Basophils (#) |
0.0-0.2 |
0.0-0.2 |
0.0-0.2 |
Red Blood Count |
4.14-5.78 |
4.18-5.86 |
3.57-5.67 |
Hematocrit |
35.3-49.9 |
38.7-51.4 |
33.9-50.9 |
Hemoglobin |
11.9-16.9 |
13.1-17.5 |
11.4-17.1 |
Mean Cell Volume (MCV) |
75.6-94.6 |
79.8-99.1 |
81.4-102.7 |
Mean Cell Hemoglobin (MCH) |
25.0-32.3 |
26.3-34.0 |
26.3-35.0 |
RDW (%) |
11.4—14.0 |
11.4-14.5 |
11.8-16.2 |
MCHC |
32.3-35.3 |
32.3-35.3 |
32.1-35.1 |
Platelet Count |
179-439 |
152-386 |
124-384 |
Mean Platelet Volume (MPV) |
6.6-10 |
6.8-10.1 |
6.6-10.2 |
Reference Ranges Females
Complete Blood Count |
18 years of age |
19-65 years of age |
66+ years of age |
White Blood Cell Count |
3.9-12.2 |
4.1-12.9 |
4.0-11.6 |
Lymphocytes (%) |
17.2-54.7 |
14.1-47.6 |
13.7-46.9 |
Lymphocytes (#) |
0.7-6.7 |
0.6-6.1 |
0.5-5.4 |
Monocytes (%) |
4.3-12.7 |
3.8-11.6 |
4.4-12.8 |
Monocytes (#) |
0.2-1.5 |
0.2-1.5 |
0.2-1.5 |
Neutrophils (%) |
31.9-74.3 |
39.8-78.1 |
40.9-78.1 |
Neutrophils (#) |
1.2-9.1 |
1.6-10.1 |
1.6-9.1 |
Eosinophils (%) |
0.6-9.9 |
0.6-7.3 |
0.6-7.5 |
Eosinophils (#) |
0.0-1.2 |
0.0-0.9 |
0.0-0.9 |
Basophils (%) |
0.1-1.6 |
0.1-1.7 |
0.1-1.7 |
Basophils (#) |
0.0-0.2 |
0.0-0.2 |
0.0-0.2 |
Red Blood Count |
3.84-5.24 |
3.64-5.2 |
3.51-5.34 |
Hematocrit |
33.5-44.6 |
32.0-45.9 |
32.8-47.0 |
Hemoglobin |
11.2-15.1 |
10.6-15.6 |
10.9-15.9 |
Mean Cell Volume (MCV) |
74.7-94.9 |
74.6-98.2 |
80.3-100.6 |
Mean Cell Hemoglobin (MCH) |
24.5-32.6 |
24.3-33.8 |
26.4-34.5 |
MCHC |
32.3-35.3 |
32.1-35.3 |
32.3-35.1 |
RDW (%) |
11.3-14.8 |
11.4-16.3 |
11.6-16.3 |
Platelet Count |
190-446 |
168-441.10 |
155-428 |
Mean Platelet Volume (MPV) |
6.6-10.0 |
6.8-10.2 |
6.7-10.5 |
Biochemistry Panel |
Results |
Units |
Reference |
Alanine Aminotransferase (ALT) |
X |
(U/L) |
Female: 0-31 Male: 0-40 |
Albumin, refrigerated serum |
X.X |
(g/dL) |
3.5-5.0 |
Alkaline Phosphatase (ALP) |
X |
(U/L) |
Female: 35-104 Male: 40-129 |
Aspartate Aminotransferase (AST) |
X |
(U/L) |
Female: 0-31 Male: 0-37 |
Bicarbonate |
X |
(mmol/L) |
22-29 |
Blood Urea Nitrogen |
X |
(g/dL) |
6-23 |
Chloride |
XX |
(mmol/L) |
96-108 |
Creatine Phosphokinase (CPK) |
X |
(IU/L) |
Female 26-192 Male: 39-309 |
Creatinine, refrigerated serum |
X.XX |
(mg/dL) |
Female: 0.51-0.95 Male: 0.67-1.17 |
Gamma-Glutamyl Transferase (GGT) |
X |
(U/L) |
Female: 7-33 Male: 11-51 |
Glucose, refrigerated serum |
X |
(mg/dL) |
60-99 |
Iron, refrigerated serum (ug/dL) |
X |
(ug/dL) |
Female: 37-145 Male: 59-158 |
Lactate Dehydrogenase (LDH) |
X |
(U/L) |
Female: 135-214 Male: 135-225 |
Phosphorus |
X.X |
(mg/dL) |
2.7-4.5 |
Potassium |
X.X |
(mmol/L) |
3.3-5.1 |
Sodium |
XXX |
(mmol/L) |
133-145 |
Total Bilirubin |
X.X |
(mg/dL) |
Up to 1.0 |
Total Calcium |
X.X |
(mg/dL) |
8.4-10.2 |
Total Cholesterol, refrigerated serum |
X |
(mg/dL) |
0-200 |
Total Protein |
X.X |
(g/dL) |
6.6-8.7 |
Triglycerides, refrigerated serum |
X |
(mg/dL) |
0-150 |
Uric Acid |
X.X |
(mg/dL) |
Female: 2.4-5.7 Male: 3.4-7.0 |
University of Minnesota Advanced
Research and Diagnostic Laboratory
|
ALT, AST, alkaline phosphatase, albumin, bicarbonate, BUN, chloride, CPK, serum creatinine, GGT, glucose, iron, LDH, phosphorus, potassium, sodium, total bilirubin, total calcium, total cholesterol, total protein, triglycerides, uric acid
|
| File Type | application/vnd.openxmlformats-officedocument.wordprocessingml.document |
| Author | Ogburn, Damon (CDC/IOD/OPHDST/NCHS) |
| File Modified | 0000-00-00 |
| File Created | 2025-01-18 |
© 2026 OMB.report | Privacy Policy