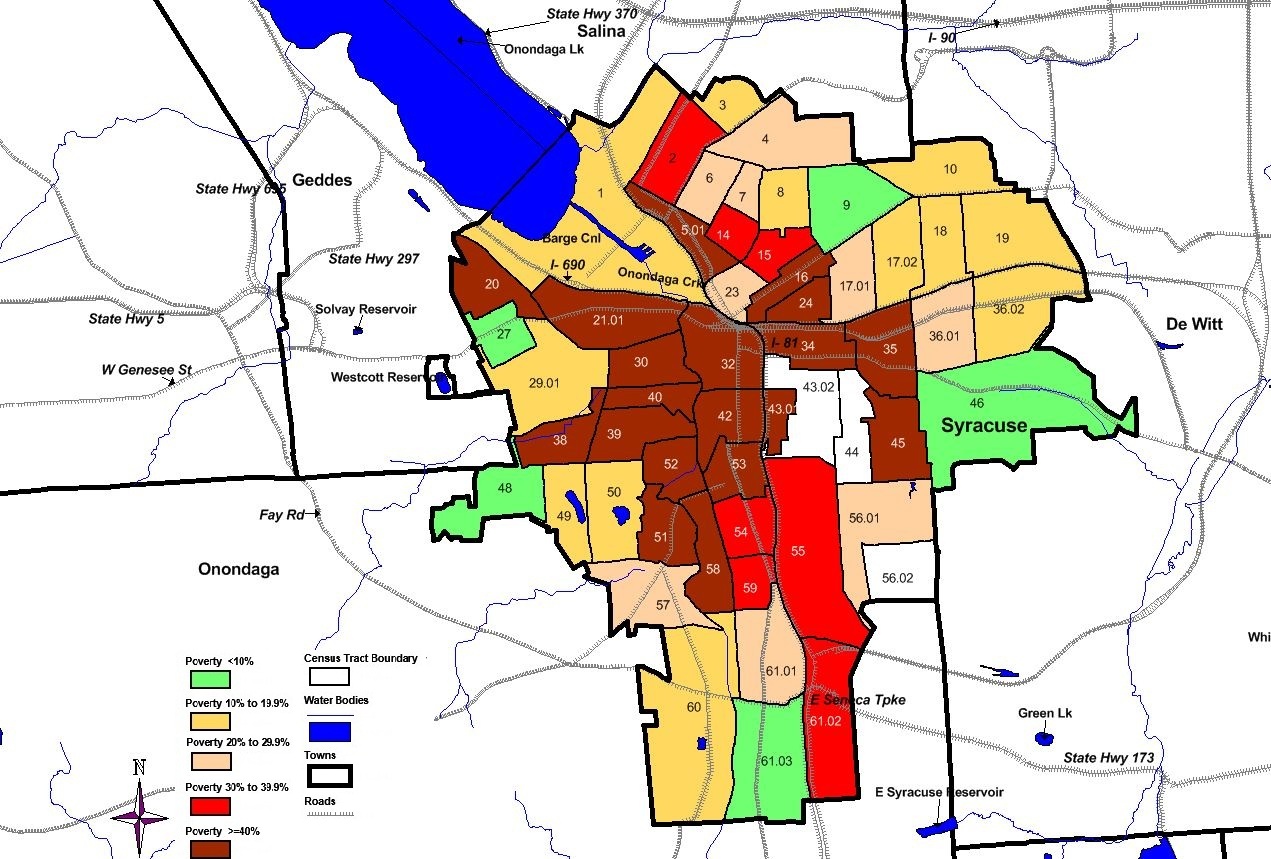
Syracuse Map Census Tracts by Poverty Rate
Att6_MapCensusTrks_poverty.docx
Biomonitoring of Great Lakes Populations Program II
Syracuse Map Census Tracts by Poverty Rate
OMB: 0923-0052
Attachment 6. Map showing Syracuse census tracts by poverty rate

Attachment 6 Table: Syracuse census tract demographics for low-income neighborhood tracts with a poverty rate of approximately 40% or higher
Demographics of tracts with a poverty rate near or higher than 40% in the Southwest neighborhood of Syracuse based on 2010 census and American Community Survey 2006-2010 data (for poverty rates). |
|||||||||||
Tract |
Total Population |
% White |
% African American |
% Asian |
% Hispanic |
% Minority |
% 20-64 years |
% >64 years |
% Female |
% Male |
% Below Poverty |
58 |
2,510 |
9.9 |
83.3 |
0.3 |
4.8 |
91.2 |
51.2 |
7.6 |
54.9 |
45.1 |
40.2 |
53 |
1975 |
13.4 |
78.9 |
0.3 |
5.4 |
87.3 |
44.3 |
13.1 |
51.3 |
48.7 |
53.0 |
52 |
2127 |
10.5 |
76.3 |
0.1 |
11.4 |
91.9 |
51.4 |
8.2 |
53 |
47 |
41.4 |
51 |
2434 |
25.4 |
61.6 |
0.2 |
12.3 |
79.7 |
55.1 |
6.3 |
54.4 |
45.6 |
43.6 |
42 |
2065 |
10.7 |
78.7 |
0.2 |
11.5 |
92.3 |
52.2 |
6.1 |
58.9 |
41.1 |
73.9 |
40 |
1580 |
33.7 |
39.6 |
0.3 |
30.6 |
74.6 |
52.7 |
6.3 |
52.7 |
47.3 |
41.1 |
39 |
3602 |
32.9 |
44.1 |
0.3 |
30.4 |
77.3 |
55.3 |
6.3 |
51.7 |
48.3 |
51.1 |
38 |
2520 |
46.7 |
31.2 |
0.4 |
23.8 |
60.8 |
52.7 |
9 |
54.8 |
45.2 |
45.8 |
32 |
2146 |
51.1 |
30.9 |
13.9 |
5.3 |
51.5 |
86.9 |
5.1 |
30.9 |
69.1 |
46.4 |
30 |
2111 |
32.6 |
47.7 |
0.2 |
34.2 |
77.1 |
58.5 |
6.9 |
46.7 |
53.3 |
58.3 |
21.01 |
2791 |
61.8 |
22.8 |
0.5 |
14.1 |
43.9 |
59 |
7.4 |
51.6 |
48.4 |
43.1 |
20 |
2264 |
79.8 |
9.6 |
0.2 |
6.7 |
23.1 |
62.6 |
7.5 |
50.2 |
49.8 |
46.6 |
54 |
2761 |
8.7 |
83.3 |
0.4 |
8.9 |
94.1 |
49.5 |
9.1 |
54 |
46 |
39.5 |
59 |
1834 |
14.6 |
75.4 |
0.3 |
11.1 |
88.5 |
51.9 |
8.8 |
53.7 |
46.3 |
37.5 |
| File Type | application/vnd.openxmlformats-officedocument.wordprocessingml.document |
| Author | Lewis-Michl, Elizabeth L (HEALTH) |
| File Modified | 0000-00-00 |
| File Created | 2021-01-26 |
© 2026 OMB.report | Privacy Policy