Sample Results Letter
Decatur EI, OMB Package, Attachment 6 - Draft Letters, 04272015.docx
ATSDR Exposure Investigations (EIs)
Sample Results Letter
OMB: 0923-0048
Attachment 6: Sample Results Letter
Flesch-Kincaid Reading Level (without agency or chemical names): 8.3
(ATSDR Letterhead)
Date
Name
Address
City, State Zip
Dear ______________:
Thank you for being a part of the Agency for Toxic Substances and Disease Registry (ATSDR) PFC exposure investigation. We tested your blood and urine for perfluorochemicals (PFCs). We are grateful for the time and effort you gave to this project. This letter is to give you your test results along with what they mean and any recommendations that we have. You may share these results with your doctor if you would like – it’s your choice.
Blood Results:
Table 1 shows the levels of eight perfluorochemicals (PFCs) found in your blood and the normal range for people in the United States.
Your result is in units of nanograms/milliliter (ng/mL). One ng/mL is the same as about one drop of ink in a large oil tanker.
Perfluorochemicals (PFCs) |
Your Level (ng/mL) |
Normal Range in the US population (ng/mL)* |
PFOA |
|
3.92 – 11.3 |
PFOS |
|
17.1 – 47.5 |
PFHxS |
|
1.8 - 8.3 |
PFNA |
|
1.10 – 3.6 |
PFDeA |
|
0.3 – 1.50 |
Me-PFOSA-AcOH |
|
0.5 - 1.8 |
Et-PFOSA-AcOH |
|
Less than 0.3 |
PFOSA |
|
Less than 0.3 |
* ng/mL, nanograms per milliliter * The levels for the U.S population are based on results from the National Health and Nutrition Examination Survey (NHANES). NHANES results are from a random sample of the U.S. population (age 12 and greater) taken in years 2005-2006. The reference range provided is from the 50th-95th percentile of the US population. |
||
Table 1: Table of individual results showing your measured PFC blood concentrations compared to what has been measured in the general Unite States Population.
INSERT APPROPRIATE TEXT BASED ON RESULTS.
Normal
The eight PFC levels in your blood are similar to most people in the United States.
Above Normal Range
In the table above, if your PFC chemical level is in bold, then that PFC is higher than most people in the United States.
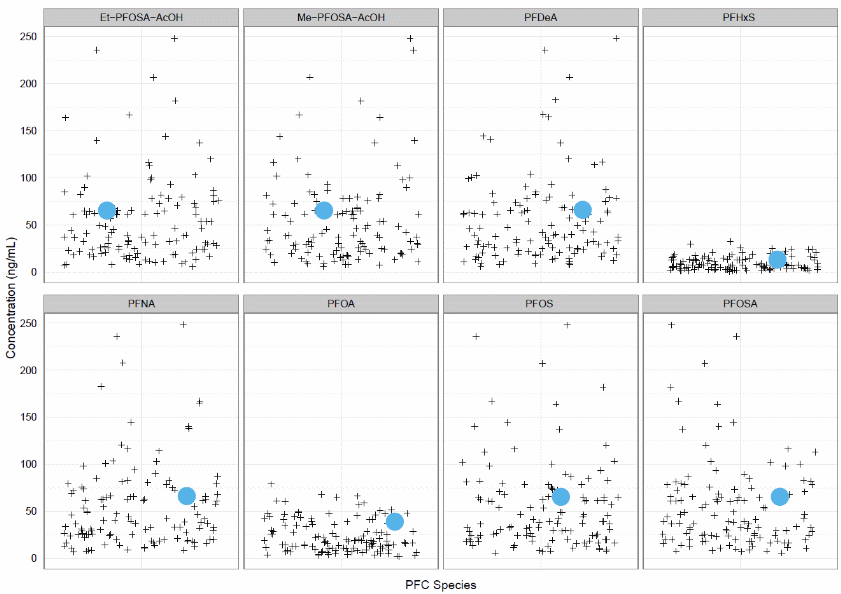
Figure 1 shows how your levels of the eight PFCs compare to others in this study. Your blood results are shown as large blue dots and the blood results of other participants are shown as small black crosses. Your blood levels were [SIMILAR TO/LOWER THAN/HIGHER THAN] other people who participated in this study.

Figure 1: Plot of individual results showing concentrations of PFCs in your blood compared to others in the study (example data).
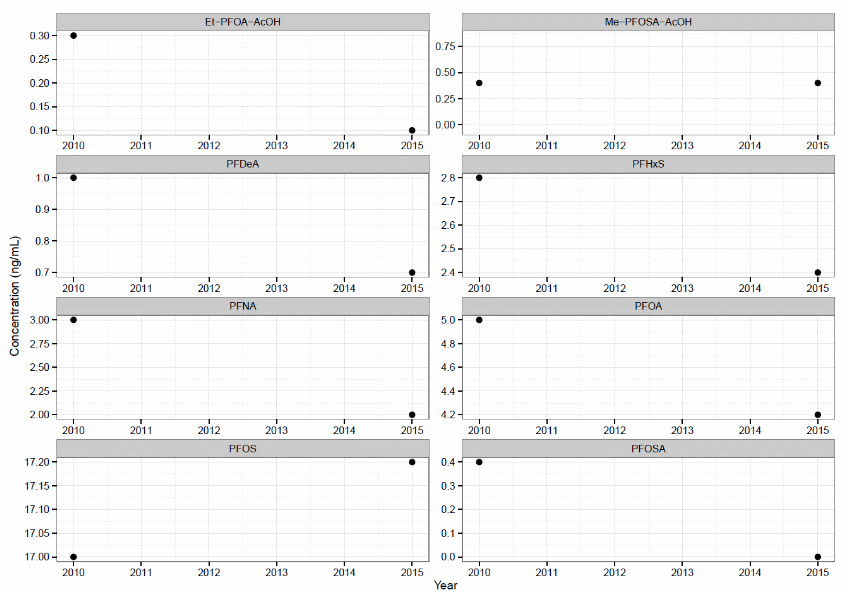
Figure 2 shows how the levels of PFCs in your blood have changed since your participation in the 2010 exposure investigation.
If your level is lower in 2015 than in 2010, you have less of the PFC in your blood. It is likely that your exposure to this PFC has decreased since 2010.
If your level is higher in 2015 than in 2010 you have more of the PFC in your blood. It is possible that your exposure to this PFC has increased since 2010.
If your level is the same in 2015 as it was in 2010 you have the same amount of this PFC in your blood now as you did in 201. It is likely that your exposure to this PFC has not changed since 2010.

Figure 2: Plot of individual results showing concentrations of PFCs in your blood measured in April 2010 and April 2015 (example data).
Urine Results:
Table 2 shows the levels of five PFCs found in your urine. It also shows the half-life of each PFC in your body and the half-life that scientists think are normal for each PFC.
The level of PFCs in your urine is in units of picograms/milliliter (pg/mL). One pg/mL is equal to one drop of ink in a string of railroad tank cars ten miles long.
The half-life is the amount of time in years that it would take for the level of each PFC in your body to go down by half, if you had no additional exposure. A short half-life means that your kidneys are removing the PFC from your body very quickly. A long half-life means that your kidneys are removing the PFC from your body slowly. Scientists have found that PFCs stay in human bodies for a long time.
Perfluorochemicals (PFCs) |
Your Level (pg/mL) |
Half-life in Your Body (years) |
Expected Half-life (years, range)* |
PFOA |
|
|
2.1 (0.19 – 5.2) |
PFOS |
|
|
6.2 (3.2 – 10) |
PFHxS |
|
|
7.7 (2.3 – 13) |
PFNA |
|
|
2.5 (0.38 – 7.7) |
PFDeA |
|
|
4.5 (1.2 – 7.7) |
* Very few studies measure biological half-life for PFCs. These estimates are based on data from a study conducted by Zhang, et al. in 2013. |
|||
Table 2: Table of individual results showing your measured PFC urine concentrations and half-lives compared to what has been measured in other studies.
What do my urine results mean?
INSERT APPROPRIATE TEXT BASED ON RESULTS
Normal
The half-lives of the PFCs measured in your urine are similar to what has been found in other studies. This means that your body is getting rid of PFCs at about the same rate as other people. The half-lives for these chemicals may naturally change during your life, but there is nothing you can do change them purposefully.
Less than expected
The half-lives of the PFCs measured in your urine are shorter than what has been found in others studies. This means that your body may be getting rid of PFCs more quickly than other people. It is normal for different people to have different half-lives for these chemicals. Having a shorter half-life does not mean there is anything wrong. A short half-life means that these chemicals stay in your body for a shorter time than other people. Scientists do not yet know if PFCs in your body will make you sick.
The half-lives for these chemicals may naturally change during your life, but there is nothing you can do change them purposefully.
Greater than expected
The half-lives of the PFCs measured in your urine are longer than what has been found in others studies. This means that your body may be getting rid of PFCs more slowly than other people. It is normal for different people to have different half-lives for these chemicals. Having a longer half-life does not mean there is anything wrong. A longer half-life means that these chemicals stay in your body for a longer time than other people. Scientists do not yet know if PFCs in your body will make you sick.
The half-lives for these chemicals may naturally change during your life, but there is nothing you can do change them purposefully.
What does this test result mean to my health?
It is not possible to link a person’s health problem to their blood PFC level. Research on PFCs is growing. PFCs cannot be definitively linked to any disease at this time.
Scientists do not definitively know how PFC levels in the blood can affect a person’s health. More research is needed, so we cannot tell a person:
if the PFC levels in their body will make them sick now or later in life.
if their current health problems are related to the PFC levels found in their body.
What are the results of the entire group that was tested in this investigation?
Once we have evaluated all the results, we will send you a summary. We will share all our findings, conclusions and recommendations.
A summary of the results of this investigation will be presented to the community later next year along with information about next steps. Your personal test results will be kept private. Only a summary will be provided to the public.
More Information
PFC Blood testing
If you or your doctor have any questions about these results or wish to further discuss these results, please call Rachel Worley or Bruce Tierney, MD at 1-855-288-0242, or email them at RWorley@cdc.gov or BTierney@cdc.gov.
Environmental information from EPA about water and soil:
EPA website: http://www.epa.gov/region4/water/PFCindex.html
EPA Region 4 - Atlanta: Ms. Connie Roberts: 404-562-9406
Thank you again for being part of the ATSDR PFC investigation.
Sincerely,
Rachel Worley
Environmental Health Scientist
Division of Community Health Investigations, Science Support Branch
The Agency for Toxic Substances and Disease Registry
Atlanta, Georgia
| File Type | application/vnd.openxmlformats-officedocument.wordprocessingml.document |
| Author | kwm5 |
| File Modified | 0000-00-00 |
| File Created | 2021-01-28 |
© 2025 OMB.report | Privacy Policy