SS Part B -- EVALUATING THE KNOWLEDGE AND EDUCATIONAL NEEDS OF STUDENTS 1-10-2013
SS Part B -- EVALUATING THE KNOWLEDGE AND EDUCATIONAL NEEDS OF STUDENTS 1-10-2013.docx
Assessing the Knowledge and Educational Needs of Students of Health Professions on Patient-Centered Outcomes Research
OMB: 0935-0210
SUPPORTING STATEMENT
Part B
Evaluating the Knowledge and Educational Needs of Students of Health Professions on Patient-Centered Outcomes Research
Version: November 26, 2012
Agency for Healthcare Research and Quality (AHRQ)
Table of Contents
B. COLLECTION OF INFORMATION EMPLOYING STATISTICAL METHODS 3
1. Respondent Universe and Sampling Methods 3
2. Information Collection Procedures 11
3. Methods to Maximize Response Rates 12
B. COLLECTION OF INFORMATION EMPLOYING STATISTICAL METHODS
1. Respondent Universe and Sampling Methods
Student Survey
Leveraging the knowledge and professional networks of the members of the student working group, resources such as membership directories and existing databases like the Association of American Medical Colleges (AAMC) will be used to define the survey population. The team will work closely with the student working group representatives to identify and obtain access to student membership databases.
1.1.1 Target Population
The target population for the Students of Health Professions Survey (SHPS) has been defined to include health professions students in the following six student subgroups:
Medical students;
Interns/residents;
Undergraduate nursing students – associates and bachelors;
Advanced nursing students – Nurse Practitioner and PhD;
Physician Assistant students;
Pharmacist students.
A target sample size of 1800 completed responses was determined to provide estimates with an appropriate level of precision and discriminatory power for analyses. The sampling frame will be stratified to ensure a representative set of students from each major health profession, with respect to geographic location, minority status group, and other relevant and available demographic characteristics, and based on the ability to acquire the full database and the availability of key demographic information in the databases.
Should the organizations be reluctant to share their database, we will work with them to sample from de-identified data and have the organizations actually disseminate the questionnaire invitation.
1.1.2 Sampling Frame
Ideally, the sampling frame for a survey would provide a current, complete, and accurate listing of all individuals in the target population, along with relevant information about each individual for use in stratification, locating, and analysis. A complete sampling frame of health professions students is not available; therefore, the team will work closely with the student working group representatives to identify and obtain access to student membership databases for use in constructing the sampling frame for the SHPS. Given that the SHPS sampling frame will provide an incomplete listing of the target population, there is the potential for under-coverage bias in the resultant survey estimates, to the extent that individuals on the SHPS sampling frame differ from individuals not covered by the sampling frame in terms of the variables of interest for the survey. This potential bias will be considered and disclosed in any discussion of survey results.
Leveraging the knowledge and professional networks of the members of the student working group, resources such as membership directories and existing databases like the Association of American Medical Colleges (AAMC) will be used to define the survey population. Contact will be made with the identified student group associations to begin the process of obtaining access to their databases for distribution of the web-based student survey (Exhibit 1 contains a preliminary list of associations). The various organizations will be contacted early in the project and provided with information about the study. Contact will be maintained with the organizations and they will be kept informed about general project progress.
Exhibit 1: Potential1 National Student Sources for Survey
Organization |
Student Involvement |
Website |
American Academy of Anesthesiologists Assistants |
Student membership* |
|
American Academy of Physician Assistants |
Student group** |
|
American Association for Respiratory Care |
Student membership |
|
American College of Nurse Practitioners |
Student membership |
http://www.acnpweb.org/ |
American Dental Hygienists' Association |
Student membership |
|
American Dietetic Association |
Student membership |
|
American Health Information Management Association |
Student group and membership |
|
American Medical Informatics Association |
Student membership |
|
American Medical Students Association |
Student group and membership |
|
American Occupational Therapy Association |
Student group |
|
American Pharmacists Association Academy of Student Pharmacists |
Student group and membership |
|
American Physical Therapy Association |
Student group |
|
American Society for Clinical Laboratory Science |
Student membership |
|
American Society for Radiologic Technology |
Student membership |
|
American Society of Clinical Pathologists |
Student membership |
|
American Speech-Language-Hearing Association |
Student group |
|
Association of American Medical Colleges |
Student group |
https://www.aamc.org/ |
Association of American Medical Colleges Organization of Resident Representatives Resident Representatives |
Student group |
https://www.aamc.org/members/orr/ |
Association of American Medical Colleges Organization of Student Representatives |
Student group |
https://www.aamc.org/members/osr/ |
Council of Academic Programs in Communication Sciences and Disorders |
Student membership |
|
National Nursing Centers Consortium |
Student membership |
|
Council of Interns and Residents |
Interns, residents, and fellows group |
|
National Student Nurses Association |
Student group |
http://www.nsna.org/default.aspx |
Sigma Theta Tau International Honor Society of Nursing |
Student membership |
|
Student National Medical Association |
Student group and membership |
|
The National Coalition of Ethnic Minority Nurses Associations |
Student membership |
|
*Student membership refers to a professional organization which includes students as members ** Student group refers to an organization which is student-led |
||
Following receipt of all lists, the SHPS sampling frame will be constructed. The lists will be reformatted to a common format, matching software will be utilized in an attempt to unduplicate persons across the various lists, and the lists will be merged to create the sampling frame. A unique, anonymized identifier will be created along with variables identifying the subgroup to which the person belongs and the source(s) from which the name was obtained. The sampling frame will contain, at a minimum, the following variables (although values may be missing for some individuals):
ID
Name
Mailing Address
e-mail Address
Student Subgroup
Source
School
Year in School
Gender
Age
Race/Ethnicity
The sampling frame will be utilized in carrying out the following purposes in the conduct of the SPHS:
Finalize sample design (discussed in Section 3)
Select SHPS sample (discussed in Section 5)
Monitor sample completion (discussed in Section 6)
Conduct data quality control and imputation (discussed in Section 7)
Derive survey weights (discussed in Section 8)
Create data tabulations (discussed in Section 10)
1.1.3 Sample Design
The sample design for the SPHS will provide the plan for sampling persons from the sampling frame in such a way as to: 1) yield a sample that is representative of the target population; 2) allow for required estimates and analyses; and 3) reduce the variability of the resultant survey estimates. Any sample design must be guided by a thorough understanding of the population distributions as they relate to the survey objectives, and of relationships between variables of interest and the known characteristics of the population available from external sources, with both informed by the survey objectives.
The sampling frame will be stratified to ensure a representative set of students and to allow for oversampling of selected subpopulations (e.g., race/ethnicity). Thus, strata will be defined on the basis of student subgroup, race/ethnicity, geography, and other relevant and available student demographic characteristics, based on the availability of key demographic information in the databases.
1.1.4 Sample Size and Allocation
Power
analysis is typically used to determine sample size required from a
simple random sample design in order for the study to detect
differences of a certain magnitude with a pre-specified probability.
Power is the probability that the study will yield a significant test
given the effect size. Power is equal to 1- ,
where
 is Type II error—the probability of not rejecting a null
hypothesis while it is false. Power is determined by three factors:
sample size, significance criterion, and difference magnitude. The
significance criterion,
 ,
is also called Type I error. It is the probability of rejecting the
null hypothesis while it is true. Difference size refers to the
magnitude of the difference under the null hypothesis. The
difference size should represent the smallest difference that would
be of substantive significance, in the sense that any smaller
difference would not be of substantive significance. These three
factors, together with power, form a closed system—once any
three are established, the fourth is completely determined.
Power
analysis can also be used to determine minimum detectable differences
(MDDs) achieved from a simple random sample of a given size with a
pre-specified power. For example, to determine the minimum
difference between two proportion estimates that could be detected
80% of the time with a sample of 100; and if we would like to declare
the test significant if, under the null hypothesis, the probability
is only 5% that the test statistic is as extreme as observed. In
this example, sample size is 100, power is 80%, and
 is
5%. In addition to these three factors, the significant test is
always specified as either one-tailed or two-tailed. A two-tailed
test will be interpreted if the difference meets the significance
criterion in either direction, i.e., the objective is to determine
whether the value differs between two subgroups but there is no a
priori assumption concerning which subgroup should have the larger
value . A one-tailed test will only be interpreted if the difference
meets the criterion of significance in the observed direction, i.e.,
the objective is to determine whether one specified subgroup of
interest has a larger value than another specified subgroup.
The other factor associated with estimating MDDs is that, while the sample design is a random sample of eligible individuals, nonresponse (although adjusted for in the survey weighting) will result in increased variability in survey estimates. As a result, the variability of the survey estimates will differ from that of a simple random sample. The ratio of the variability associated with a given sample design to that associated with a simple random sample of the same size is referred to as the design effect (DEFF).
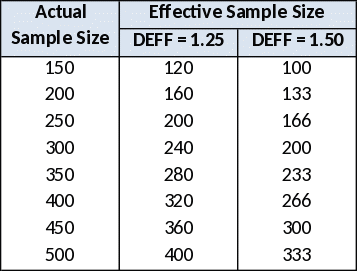
Given the sample design, potential oversampling of selected subpopulations (see Section 5), and likely nonresponse, it is reasonable to expect the variability of the survey estimates will be higher than those from a simple random sample, and thus the DEFF will be greater than one. Based on experience with similar types of studies, such as education studies wherein students are sampled from schools, it is reasonable to assume the proposed sample design will yield a DEFF in the neighborhood of 1.25 to 1.5. Exhibit 2 presents the impact of DEFF on effective sample sizes. For example, if a survey with a DEFF of 1.50 achieves a sample size of 150 cases, the resultant variability will be the same as that as a simple random sample of only 100 cases. Thus, more sample cases are required to achieve the same precision on survey estimates.
Exhibit 2: Impact of DEFF on Effective Sample Size
Exhibit
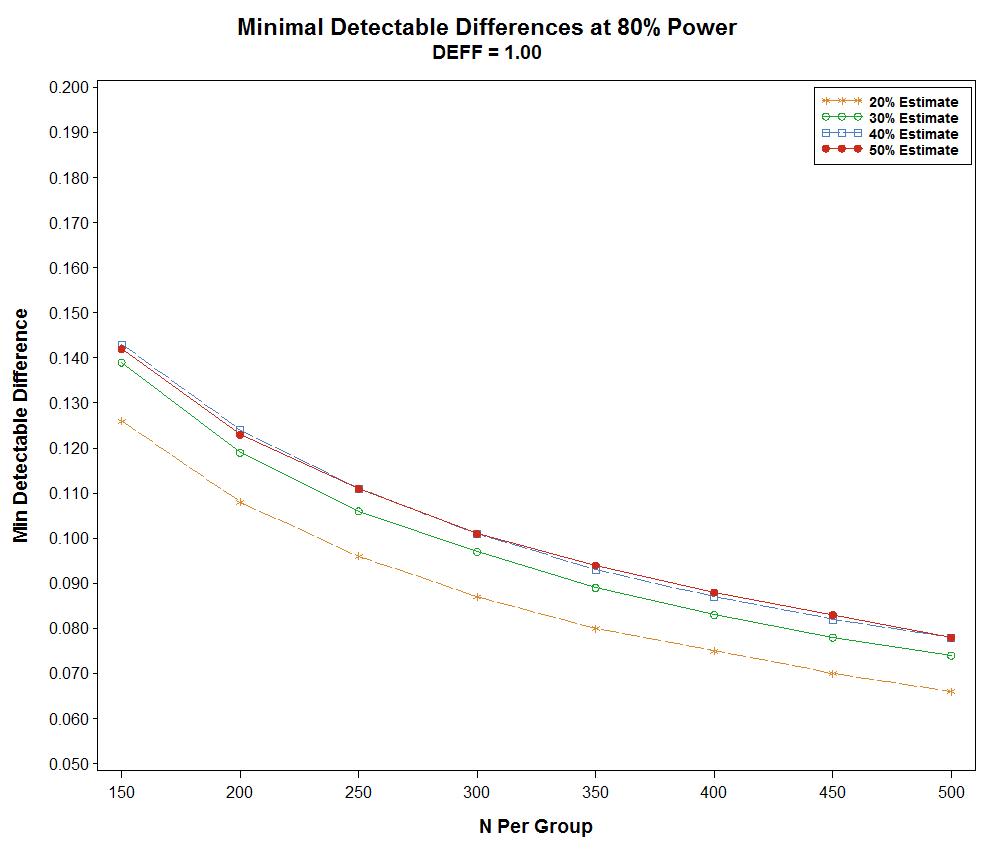
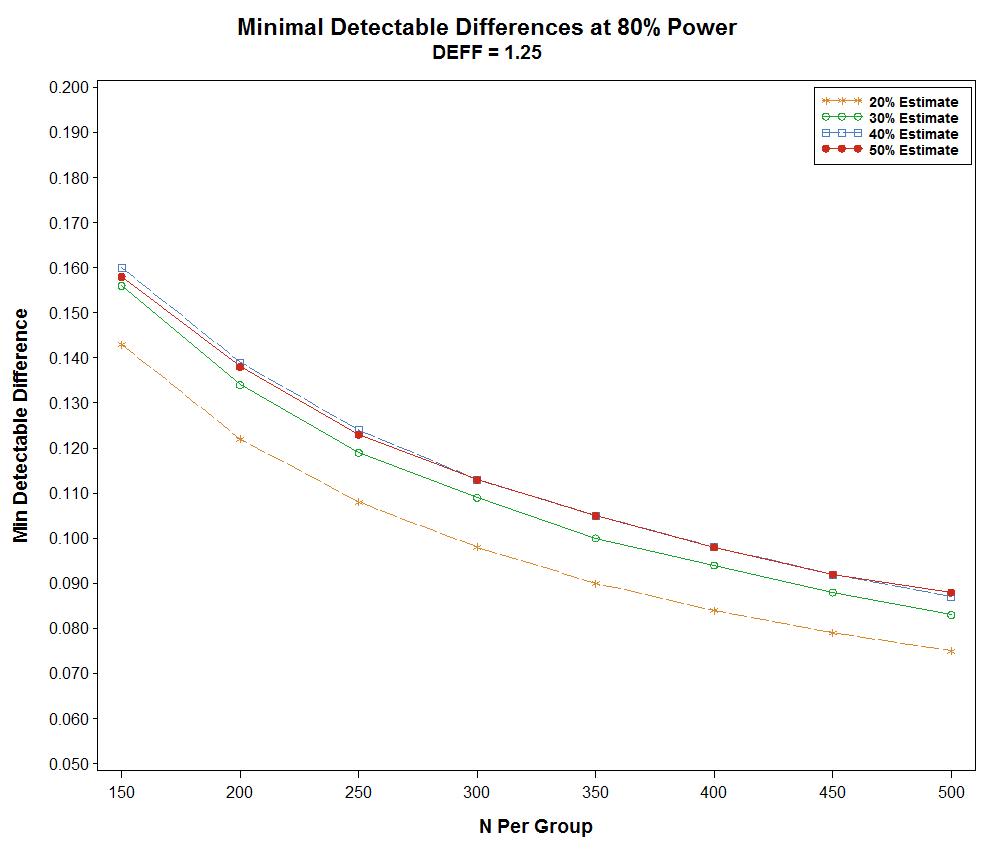
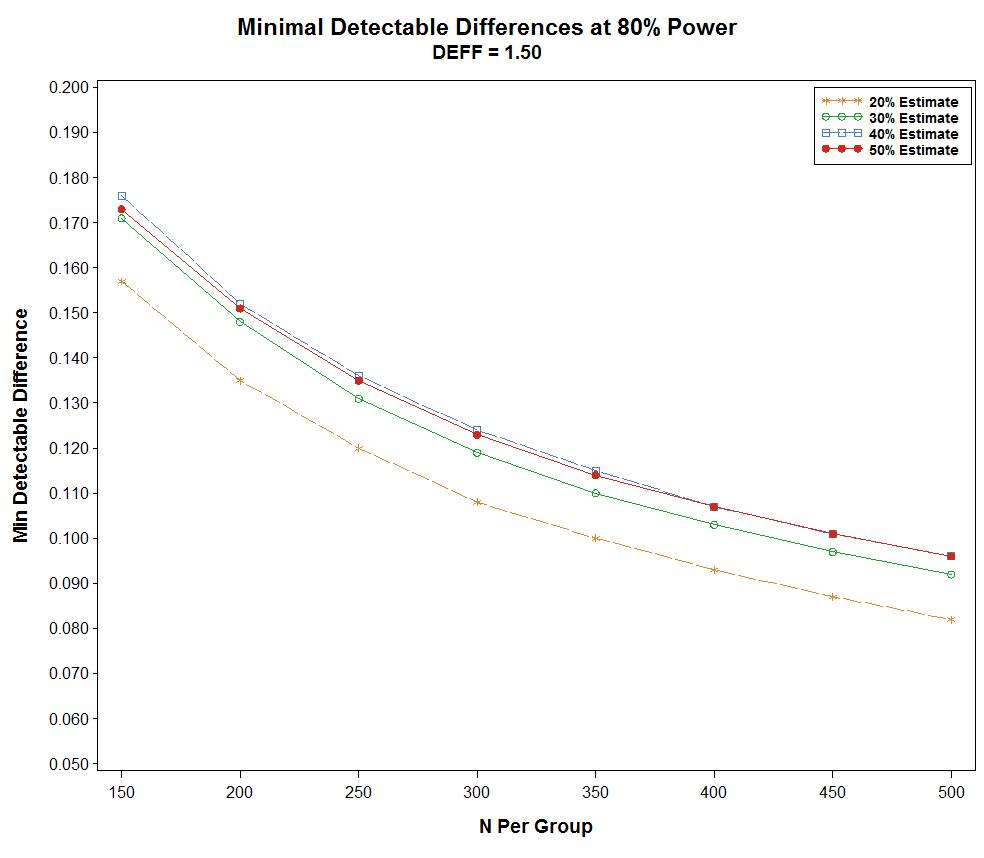
3 presents the MDDs for two-sample two-tailed proportion tests, given
differing sample sizes per group (150 to 500, by 50) and DEFFs (1.0,
1.25, 1.5). Parameters for comparisons assume
 ,
and
,
and
 .
For example, when comparing proportions between two groups of size
150 for a parameter with a 20% value, expected MDDs would be 12.6 –
15.7 percentage points, depending upon the DEFF actually resulting
from the implementation of the sample design.
Exhibit 3: Minimum Detectable Differences for SHPS, by Potential Target Sample Sizes

Viewing the results from Exhibit 3, it can be seen that, at a sample size of 300, the decrease in MDD resulting from increasing the sample size by 50 drops below 1.0 percentage points. The following three figures present the same information as Exhibit 3, but for continuous values of the sample size. The graphs show that increasing sample sizes decreases MDD, but that the rate of decrease diminishes as the sample size increases.
Another means of determining sample size is to examine the precision of point estimates from the survey. Exhibit 4 presents expected precision at the 95% confidence level for the same range of sample sizes as in Exhibit 3.
Exhibit 4: Expected Precision for SHPS, by Potential Target Sample Sizes

Here again, although the expected precision improves as the sample size increases, the rate of improvement decreases, with improvement of more that 0.5 percentage points for every sample size increase of 50 ending at a sample size of 300.
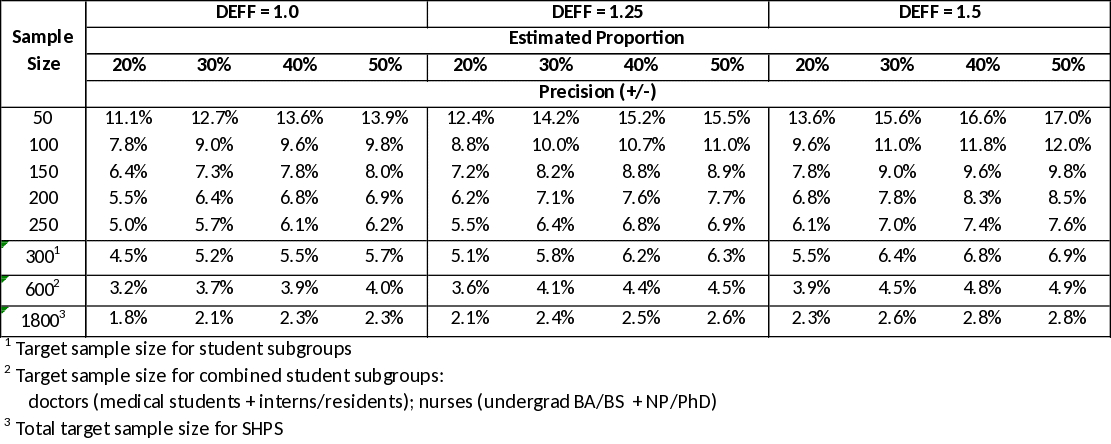
As a result of these assessments and mindful that, while larger sample sizes offer improved precision and discriminatory power they also incur greater costs, target sample sizes of 300 for each student subgroup for the SHPS are recommended. With six student subgroups, this results in a total recommended target sample size of 1,800. Exhibit 5 presents expected precision for each student subgroup (n=300), for combined doctor and nurse student subgroups (n=600), for the total SHPS sample (n=1,800), and for selected smaller sample sizes that may be achieved through disaggregation of the sample (e.g., race/ethnicity).
Exhibit 5: Expected Precision for SHPS
Sample size within student subgroup will be allocated across race/ethnicity and geography so as to achieve sufficient sample sizes for analysis. As a result, students in selected race/ethnicity groups may be oversampled relative to the overall sampling rate.
1.1.5 Sample Selection
The recommended sample size of 300 per student subgroup represents the number of completed interviews to be achieved from the survery. However, not all students contacted will respond to the survey. As a result, a larger sample size will be selected, based upon expected response rates, so as to yield the target number of 300 completes within each student subgroup. The sampling frame will be segmented into the strata (student subgroup, race/ethnicity, geography, other to be determined). Sample will be selected in a systematic fashion within each design stratum.
1.1.6 Sample Monitoring
To aid in achieving target sample sizes within strata, sample monitoring reports will be generated on a periodic basis for review by the data collection staff.
1.1.7 Data Quality Control and Imputation
Following data collection, a data file will be created containing information from the survey. Sample data will be reviewed electronically to ensure completeness, and consistency. Where necessary, values will be imputed where missing or determined to be in error.
1.1.8 Survey Weighting
Survey weights are required to enable estimates from the sample data, thereby enabling appropriate inferences for the total target population and subgroups. The survey weights take into account the probability of selection of the sample person, adjustment for survey nonresponse, and ratio adjustment to population totals.
Base weights are defined as the inverse of the probability of selection for the sample person. Given the sample design, sample persons from different strata will have different probabilities of selection.
Nonresponse adjustment is carried out in weighting through techniques such as weighting class and response propensity, designed to control the potential for nonresponse bias affecting survey estimates. Potential correlates available from the sampling frame, in addition to the stratification variables, will be examined to identify that set correlated with response probability, and used in the nonresponse adjustment.
Finally, survey weights are adjusted so weighted sample counts agree with population totals for subgroups used in tabulations and analyses.
1.1.9 Variance Estimation
Finally, the precision of the resultant survey estimates will be determined. An appropriate variance estimation approach, likely Taylor Series, will be defined for use. Variance strata will be defined by the sample design strata used in selecting the sample (i.e., student subgroup, race/ethnicity, geography, any other if used). Survey documentation will include formulae to be used in deriving variance estimates, along with example code for use with SAS.
1.2 Faculty Interviews
Up to 24 faculty informants will be selected based on current team contacts and publicly available information to ensure a representation from a range of professions, regions, and institution type, with an emphasis on faculty of institutions affiliated with under-represented populations. Referral or ‘snowball’ sampling may be used to reach additional contacts.
2. Information Collection Procedures
2.1 Student Survey
Email invitations will be sent to students to participate in the web-based survey. Each respondent will be assigned a unique UserID and password, which will be delivered in the recruitment email and reiterated during all prompting contacts with non-responders. Following best practices, the UserID and password will meet security requirements but will not be represented by long strings of difficult to transcribe letters and numbers. The Web user-interface will be streamlined, attractive, and intuitive, utilizing simple question layouts and response formats.
Respondents will be provided with a “resume” capability that allows them to break off the session mid-survey and then return to the survey at a later time to complete it without losing previously entered data.
The instrument will be programmed with machine checks and automatic prompts to ensure inter-item consistency and reduce the likelihood of “don’t know” or “refuse” responses.
Collected data will be cleaned and subsequently analyzed in SAS software.
2.2 Faculty Interviews
Informant background and contact information will be compiled from publicly available information. Interview protocols will be tailored for each respondent. Email invitations will be sent to informants and an interview schedule will be developed. Interview sessions will be audio recorded with the permission of the informant. A written summary of each interview with themes and findings will be created.
3. Methods to Maximize Response Rates
3.1 Student Survey
The key strategies below, which have been demonstrated to engage health professionals in the research objectives and achieve high response rates, will be utilized. The strategies will be discussed with the student working group to ensure the recruitment efforts resonate with the target population.
Supporting organizations (primarily student associations) will be asked to provide a short notice of the upcoming survey effort in their regular communications (newsletters, blog postings, etc.) and other media approximately one month prior to the survey effort.
A preliminary informational email will be sent to the potential respondents with the imprimaturs of the participating organization and AHRQ imprimatur approximately one week prior to email distribution of the survey link.
The email survey invitation will be personalized for each respondent.
The importance of the research will be emphasized, with specific focus on how the data will be used to make systematic improvements. A key component of the survey administration is the respondent invitation email. The email will stress the value of their participation to obtain high quality data, provide background on the study, describe how the data will be used by the researchers and AHRQ to improve educational efforts surrounding PCOR, and provide an estimated time to complete the instrument and, include a description of the incentive for completion. The letter will also provide an e-mail address to contact if they have questions or comments.
Two days after the recruitment letter, respondent prompting using email communications will begin for non-responders. Additional prompts will be set during week 1, 2 and 4 of the data collection period. The emails will remind respondents of the study purpose, provide their UserID and Password, and include a hyperlink to the web-based survey.
3.2 Faculty Interviews
Faculty will be invited to participate in the survey using an emailed letter. The letter will emphasize the importance of the research, with a specific focus on how the data will be used to make systematic improvements. It will also stress the value of their participation to obtain high quality data, provide background on the study, describe how the data will be used by the researchers and AHRQ to improve educational efforts surrounding PCOR, and provide an estimated time to complete the interview. The letter will also provide an e-mail address to contact if the respondent has questions or comments.
The instruments were pre-tested for content, wording and time needed for administration by faculty (for the faculty surveys) and by the student work group (for the student survey). This pre-test was considered adequate for the purposes of this study.
The statistical aspects of this study design were developed by James Bell Associates Inc., 3033 Wilson Boulevard, Suite 650, Arlington VA 22201, 703-528-3230, in consultation with its subcontractor for this project, NORC at the University of Chicago, and AHRQ. The organization responsible for data collection activities and analysis during the entire evaluation process is James Bell Associates Inc.
1 The actual organizations selected will depend on factors such as ease of access to the lists and the level of duplication across lists.
| File Type | application/vnd.openxmlformats-officedocument.wordprocessingml.document |
| Author | DHHS |
| File Modified | 0000-00-00 |
| File Created | 2021-01-29 |
© 2025 OMB.report | Privacy Policy